Tag: cost of delay

  • The Cost of Too Many Projects in Portfolio

    I argued against multitasking a number of times. In fact, not that long ago I argued against it in the context of portfolio management too. Let me have another take on this from a different perspective.

    Let’s talk about how much we pay for introducing too many concurrent initiatives in our portfolios. I won’t differentiate here between product and project portfolios because for the sake of this discussion it doesn’t matter that much.

    Let’s imagine that the same team is involved in four concurrent initiatives. Our gut feel would suggest that this is rather pessimistic assumption, but when we check what organizations do it is typically much worse than that. For the sake of that discussion and to have nice pictures let’s assume that all initiatives are similarly sized and start at the same time. The team’s effort would be distributed roughly like that.

    Portfolio planning

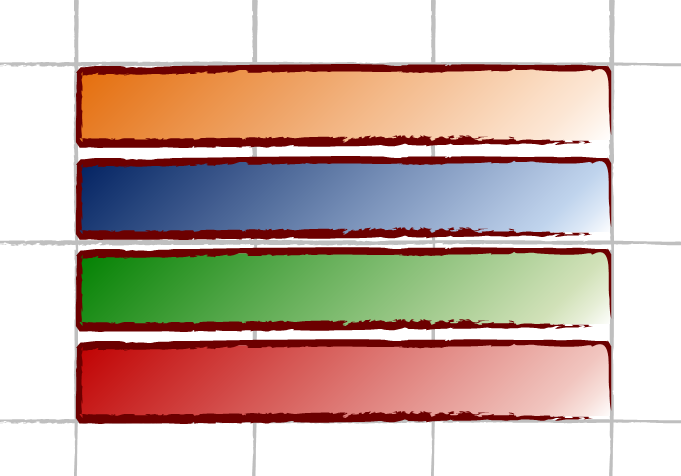
    The white space between the bars representing project work would be cost of multitasking. Jerry Weinberg suggests that for each concurrent task we work on we pay the tax of 20% of the time wasted on context switching. Obviously, in the context of concurrent projects and not concurrent tasks the dynamics will be somewhat different so let me be optimistic with what the cost in such scenario would be.

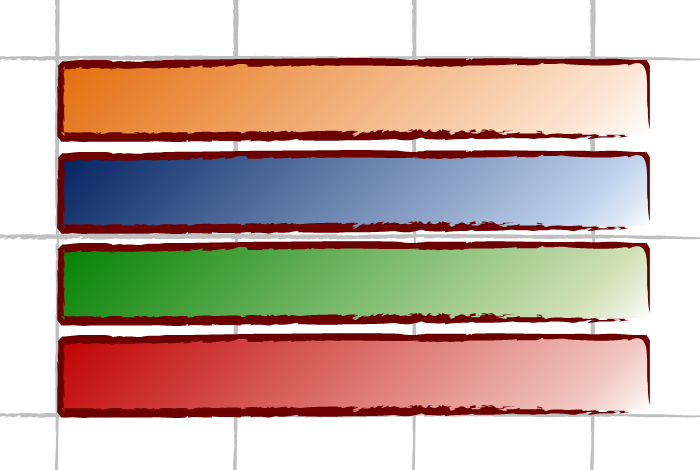
    If we reorganize the work so that we limit the number of concurrent initiatives to two we’d see slightly different picture.

    Portfolio planning

    Suddenly we finished faster. Where’s the difference? Well, we wasted much less time on context switching. I assumed some time required for transition from one project to another yet still, it shouldn’t be close to what we waste on context switching.

    In fact, we can move it even further than that and limit the work to a single project or product at the same time.

    Portfolio planning

    We improved efficiency even more. That’s the first win, and not the most important one.

    Another thing that happened is we started each project with the exception of the first one in presence of new information. We could have, and should have, learned more about our business so that we are better equipped to run another initiative.

    Not only that. It is likely that technology itself or our understanding of technology advanced over the course of running the first project and thus we will be more effective building another one. These effects stack up with each consecutive project we run.

    Portfolio planning

    The total effect will be further improvement of the total time of building our projects or products. This is the second win.

    Don Reinertsen argues that the longer the project is the longer the budget and schedule overrun. In other words, if we decided to go with all the concurrent initiatives we’d likely to go longer that we assumed.

    In short it means that we do end up doing more work that we would do otherwise. Projects are, in fact, bigger than we initially assumed.

    Portfolio planning

    The rationale for that is that the longer the project lasts the bigger the incentive to cram more stuff into it as the business environment keeps evolving and we realize that we have new market expectations to address.

    Of course there’s also an argument that with bigger initiatives we have more uncertainty so we tend to make bigger mistakes estimating the effort. While I don’t directly refer to estimates here, there’s an amplification effect for scope creep which is driven by overrunning a schedule. When we are late the market doesn’t stand still. To make up for that we add new requirements, which by the way make the project even later so we add even more features, which again hit the schedule…

    A bottom line is that with bigger projects scope creep can get really nasty. With fewer concurrent initiatives and shorter lead times we get the third win.

    Let’s assume that we’ve had deadlines for our projects.

    Portfolio planning

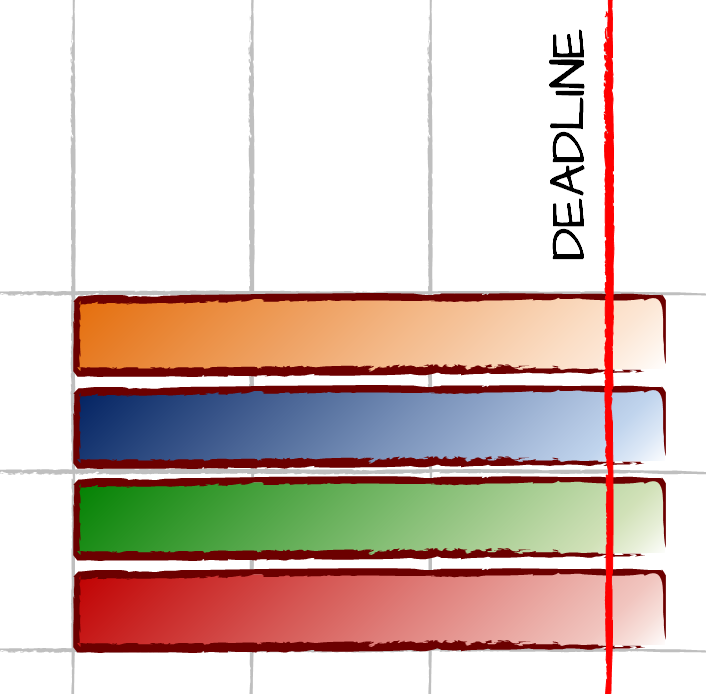
    What happens when we’re late? Well, we pull more people from other teams. Well, maybe there was one guy who said that adding people to the late project makes it later but, come on, who reads such old books?

    Since in this case all our projects are late we’d pull people from another part of an organization. That would make their life more miserable and their project more likely to be late and eventually they will reciprocate taking our people from our future projects in a futile attempt to save theirs. That would introduce more problems in our future projects. No worries, there will be payback time when we steal their people again, right?

    It’s a kind of reinforcement loop that we can avoid with fewer concurrent initiatives. That’s a fourth win.

    Finally, we can focus on economies of delivering our products or projects. A common sense argument would be to bring time to market as an argument in a discussion. Would we prefer shorter or longer time to market? The answer is pretty much obvious.

    To have a meaningful discussion on that we may want to discuss Cost of Delay. How much it costs us to delay each of these projects. It may translate to the situation when we don’t generate revenues or the one when we lose the existing ones. It may translate to the situation when we won’t optimize cost or fail to avoid new costs.

    In either case there’s an economic value of delivering the initiative later. In fact knowing the Cost of Delay will likely change the order of delivering projects. If we assume that the last project had the biggest Cost of Delay, the first the smallest (4 times smaller) and the middle ones the same in the middle of the spectrum (a half) we’ll end up building our stuff in another order.

    Portfolio planning

    The efficiency of using the teams is the same. The economic effect though is vastly different. This is the biggest win of all. Including all other effects we roughly cut down the total delay cost by two thirds.

    The important bit of course is understanding the idea of Cost of Delay. However, this couldn’t have been enabled if we’d kept running everything in parallel. In such a situation everything would be finished at the same time – at the latest possible moment. In fact, if we avoid concurrent work even the ultimately wrong choice of the order of the projects would yield significantly better economic results than building everything at the same time.

    What we look at is a dramatic improvement in the bottom line of the business we run. The effects of limiting a number of concurrent initiatives stack up and reinforce one another.

    Of course, it is not always possible to delay start of specific batch of work or limit the number of concurrent projects to very low number. The point is though that this isn’t a binary choice: all or nothing. It is a scale and typically the closer we can move toward the healthy end of it the bigger the benefits are.

  • WIP Limits Revisited

    One of things you can hear repeatedly from me is why we should limit work in progress (WIP) and how it drives continuous improvement. What’s more, I usually advise using rather aggressive WIP limits. The point is that you should generate enough slack time to create space and incentive for improvements.

    In other words, the goal is to make people not doing project or product development work quite frequently. Only then, freed from being busy with regular stuff, they can improve the system which they’re part of.

    The part which I was paying little attention to was the cost of introducing slack time. After all, these are very rare occasions when clients pay us for improvement work, so this is some sort of investment that doesn’t come for free.

    This is why Don Reinertsen’s sessions during Lean Kanban Europe Tour felt, at first, so unaligned with my experience. Don advises to start with WIP limits twice as big as average WIP in the system. This means you barely generate any slack at all. What the heck?

    Let’s start with a handful of numbers. Don Reinertsen points that WIP limit which is twice as big as average WIP, when compared to no WIP limit at all, ends up with only 1% idle time more and only 1% rejected work. As a result we get 28% improvement in average cycle time. Quite an impressive change for a very small price. Unfortunately, down the road, we pay more and more for further improvements in cycle time, thus the question: how far should we drive WIP limits?

    The further we go the more frequently we have idle time, thus we waste more money. Or do we? Actually, we are doing it on purpose. Introducing slack to the system creates an opportunity to improve. It’s not really idle time.

    Instead of comparing value of project or product work to idle time we should compare it to value of improvement work. The price we pay isn’t that high as it would initially seem basing simply on queuing theory.

    Well, almost. If we look at the situation within strict borders of a single project value of improvement work is non-existent or intangible at best. How much better will the product be or how much faster will we build remaining features? You don’t know. So you can’t say how much value these improvements will add to the project.

    However, saying that the improvements are of no value would be looking from a perspective of optimizing a part; in this case a single project. Often impact of such improvements will be broader than within borders of the project and it will last longer than the project’s time span.

    I don’t say I have a method you may use to evaluate cost and value attached to non-project work. If I had I’d probably be a published author by now, had lots of grey hair and a beer belly twice as big. My point is that you definitely shouldn’t account all non-project work as waste. Actually, most of the time cost of this work will be smaller than value you get out of it.

    If we based purely on Don Reinertsen’s data and assumed that whenever we hit WIP limit people are idle we could come up with such a chart:

    On a horizontal axis we have WIP limits going from infinite (no WIP limit at all) to aggressive WIP limits inflicting much slack time. On a vertical axis we have overall impact on a system. As we introduce WIP limits (we go to the right side of the chart) we gain value thanks to shorter average cycle times and, at least at the beginning, improved throughput. At the same time we pay the cost of delay of rejected or queued work waiting to enter the system (in backlog) and the cost of idle time.

    In this case we reach the peak point of the curve pretty quickly, which means that we get most value with rather loose WIP limits. We don’t want to introduce too much idle time to the system as it’s our liability.

    However, if we start thinking in terms of slack time, not idle time, and assume that we are able to produce enough value during slack time to compensate the cost the chart will be much different.

    In the case number two the only factor working against us is cost of delay of work we can’t start because of WIP limits. The organization still has to pay for people doing non-project work, but we base on assumption that they create equal value during slack time.

    The peak of the curve is further to the right, which means that the best possible impact happens when we use more aggressive WIP limits than in the first case.

    Personally, I’d go even further. Basing on my past experience I’d speculate that often slack time results in improvements that have positive overall impact on the organization. In other words it would be quite a good idea to fund them as projects as they simply bring or save money. It gives us another scenario.

    In this case impact of slack time is positive so it partially compensates increasing cost of delay, as we block more items to enter the system. Eventually, of course, overall impact is negative in each case as at the end of horizontal axis we’d have WIP limit of 0, which would mean infinite cost of delay.

    Anyway, the more interesting point to look at is the peak of each curve, as this is a sweet spot for our WIP limits. And this is something we should be looking for.

    I guess, by this time you’ve already noticed that there are no numbers on the charts. Obviously, there can’t be any. Specific WIP limits would depend on a number of context-dependent factors, like a team size, process complexity or external dependencies, to mention only the most obvious ones.

    The shape of curves will depend on the context as well. Depending on the work you do cost of delay can have different impact, same as value of improvements will differ. Not to mention that cost attached to slack time vary as well.

    What I’m trying to show here is that introducing WIP limits isn’t just a simple equation. It’s not without a reason that no credible person would simply give you a number as an answer for a question about WIP limits. You just have to find out by yourself.

    By the way, the whole background I drew here is also an answer for the question why my experience seemed so unaligned with ideas shared by Don Reinertsen. I just usually see quite a lot value gained thanks to wise use of slack time. And slack time, by all means, should be accounted differently than idle time.