Tag: lead time

  • Economic Value of Slack Time

    I ranted on 100% utilization a few years ago already. Let me add another thread to that discussion. We have a ton of everyday stories that show how brain-dead the idea of maximizing utilization is. Sometimes we can figure out how it translates to work organization as well. Interestingly, what Don Reinertsen teaches us is that queuing theory says exactly the same.

    As we go up with utilization lead time or wait time goes up as well. Except the latter grows exponentially. It looks roughly like that.

    Cost of high utilization

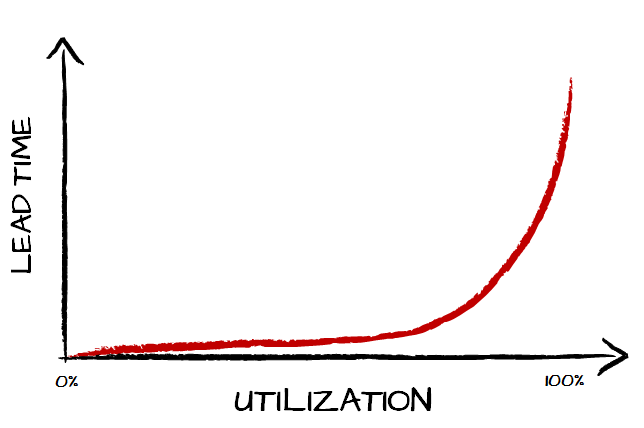
    But wait, does it mean that we should strive to have as low utilization as possible? I mean, after all that’s where lead times are the shortest. This doesn’t sound sensible, right?

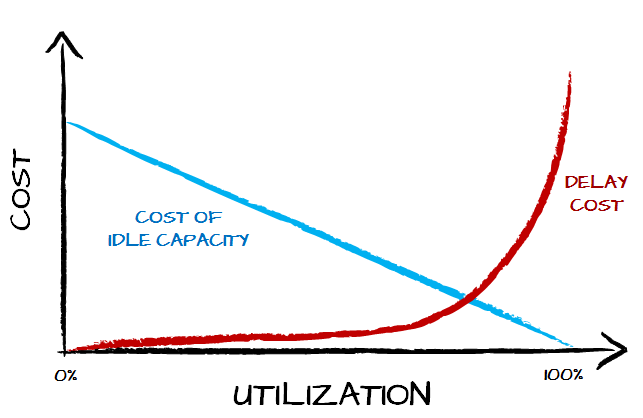
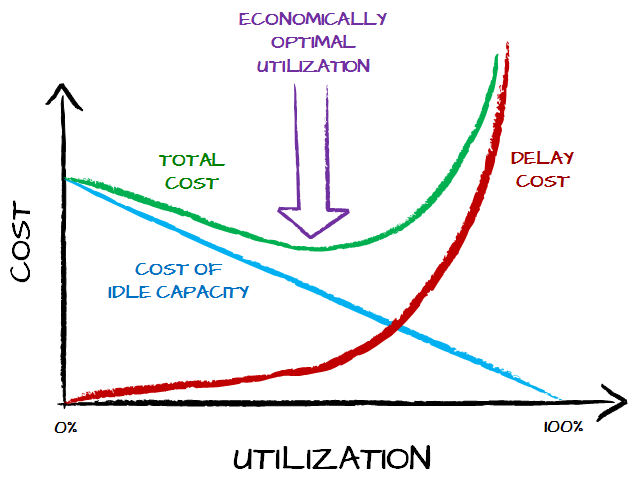
    And it doesn’t make sense indeed. Cost of waiting is only one part of this equation. The other part is cost of idle capacity. We have people doing nothing thus they don’t produce value yet they cost something. From that perspective we have two cost components: delay cost related to long lead time and cost of idle capacity related to low utilization.

    Cost of high utilization

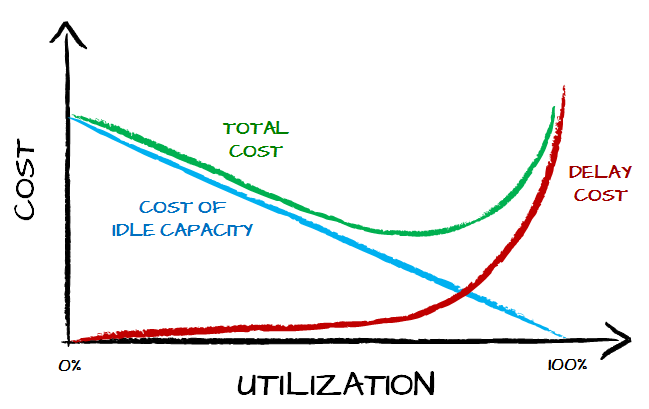
    Of course the steepness of the curves would differ depending on the context. The thing is that the most interesting part of the chart is the sum of the costs which, naturally, is optimal at neither end of scale.

    Cost of high utilization

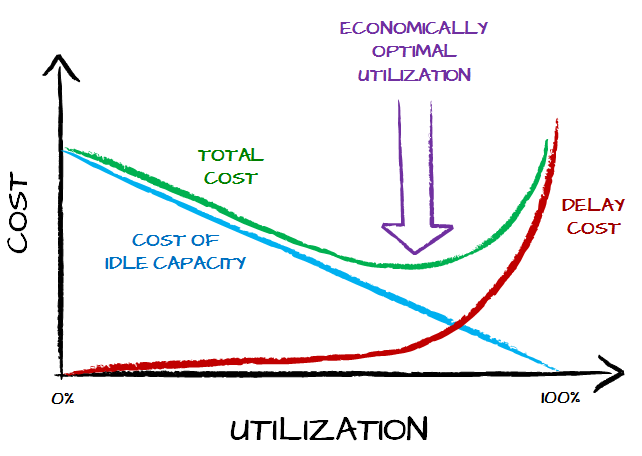
    There is some sort of economic optimum for how much a system should be utilized to work most cost efficiently. There’s very good news for us though. The cost curve is the U-curve with flat bottom. That means that we don’t need to find the ideal utilization as a few percent here or there doesn’t make a huge difference.

    We’d naturally think that the optimum is rather toward the more utilized part of the scale. That’s where the interesting part of the discussion starts.

    Economically optimal utilization

    We have pretty damn good idea how much idle time or slack time costs us. This part is easy. Now, the tricky question: how much is shorter lead time worth?

    Imagine yourself as a Product Owner in a funded startup providing an online service. Your competitor adds a new feature that generates quite a lot of buzz on social media. How long are you willing to wait to provide the same feature in your app? Would keeping an idle team all the time just in case you need to build something super-quickly be justified?

    Now imagine that your house is on fire. How long are you willing to wait for a fire brigade? Would keeping an idle fire brigade just in case be justified?

    Clearly, there are scenarios where slight differences in lead time are of huge consequences. We don’t want our emergency calls to be queued for a couple of weeks because a fire brigade or an ambulance service is heavily utilized. In other words steepness of one of the curves varies a lot.

    Let’s look how different scenarios change the picture.

    Economically optimal utilizationEconomically optimal utilization

    This sets the economically optimal utilization at very different levels. There are contexts where a lot of slack is perfectly justified. The ultimate example I can come up with are most of armies. We don’t expect them to be fully engaged in wars all the time. In fact the more slack armies have the better. Somehow we don’t come up with an idea that if an army has no war to run we better find them one.

    Of course it does matter how they use their slack time, but that’s another story.

    We don’t have that drastic examples of value of slack in software industry. However, we also deal with very different steepness of delay cost curve. Even if we don’t expect instant delivery we need to move quicker and quicker as everyone else does the same.

    The bottom line is that our intuition about what is the cost of wait time (delay cost) is often flawed. This means that even if we are able to go beyond the myth of 100% utilization we still tend to overload our teams too much.

    Oh, and if you wondered, at Lunar Logic our goal is to keep team’s utilization between 80% and 90%.

  • (Sub)Optimizing Cycle Time

    There is one thing we take almost for granted whenever analyzing how the work is done. It is Little’s Law. It says that:

    Average Cycle Time = Work in Progress / Throughput

    This simple formula tells us a lot about ways of optimizing work. And yes, there are a few approaches to achieve this. Obviously, there is more than the standard way, used so commonly, which is attacking throughput.

    A funny thing is that, even though it is a perfectly viable strategy to optimize work, the approach to improve throughput is often very, very naive and boils down just to throwing more people into a project. Most of the time it is plain stupid as we know from Brook’s Law that:

    Adding manpower to a late software project makes it later.

    By the way, reading Mythical Man-Month (the title essay) should be a prerequisite to get any project management-related job. Seriously.

    Anyway, these days, when we aim to optimize work, we often focus either on limiting WIP or reducing average cycle time. They both have a positive impact on the team’s results. Especially cycle time often looks appealing. After all, the faster we deliver the better, right?

    Um, not always.

    It all depends on how the work is done. One realization I had when I was cooking for the whole company was that I was consciously hurting my cycle time to deliver pizzas faster. Let me explain. The interesting part of the baking process looked like this:

    Considering that I’ve had enough ready-to-bake pizzas the first setp was putting a pizza into the oven, then it was baked, then I was pulling it out from the oven and serving. Considering that it was almost a standardized process we can assume standard times needed for each stage: half a minute for stuffing the oven with a pizza, 10 minutes of baking and a minute to serve the pizza.

    I was the only cook, but I wasn’t actively involved in the baking step, which is exactly what makes this case interesting. At the same time the oven was a bottleneck. What I ended up doing was protecting the bottleneck, meaning that I was trying to keep a pizza in the oven at all times.

    My flow looked like this: putting a pizza into the oven, waiting till it’s ready, taking it out, putting another pizza into the oven and only then serving the one which was baked. Basically the decision-making point was when a pizza was baked.

    One interesting thing is that a decision not to serve a pizza instantly after it was taken out of the oven also meant increasing work in progress. I pulled another pizza before making the first one done. One could say that I was another bottleneck as my activities were split between protecting the original bottleneck (the oven) and improving cycle time (serving a pizza). Anyway, that’s another story to share.

    Now, let’s look at cycle times:

    What we see on this picture is how many minutes elapsed since the whole thing started. You can see that each pizza was served a minute and a half after it was pulled out from the oven even though the serving part was only a minute long. It was because I was dealing with another pizza in the meantime. Average cycle time was 12 minutes.

    Now, what would happen if I tried to optimize cycle time and WIP? Obviously, I would serve pizza first and only then deal with another one.

    Again, the decision-making point is the same, only this time the decision is different. One thing we see already is that I can keep a lower WIP, as I get rid of the first pizza before pulling another one in. Would it be better? In fact, cycle times improve.

    This time, average cycle time is 11.5 minutes. Not a surprise since I got rid of a delay connected to dealing with the other pizza. So basically I improved WIP and average cycle time. Would it be better this way?

    No, not at all.

    In this very situation I’ve had a queue of people waiting to be fed. In other words the metric which was more interesting for me was lead time, not cycle time. I wanted to optimize people waiting time, so the time spent from order to delivery (lead time) and not simply processing time (cycle time). Let’s have one more look at the numbers. This time with lead time added.

    This is the scenario with protecting the bottleneck and worse cycle times.

    And this is one with optimized cycle times and lower WIP.

    In both cases lead time is counted as time elapsed from first second, so naturally with each consecutive pizza lead times are worse over time. Anyway, in the first case after four pizzas we have better average lead time (27.75 versus 28.75 minutes). This also means that I was able to deliver all these pizzas 2.5 minutes faster, so throughput of the system was also better. All that with worse cycle times and bigger WIP.

    An interesting observation is that average lead time wasn’t better from the very beginning. It became so only after the third pizza was delivered.

    When you think about it, it is obvious. Protecting a bottleneck does make sense when you operate in continuous manner.

    Anyway, am I trying to convince you that the whole thing with optimizing cycle times and reducing WIP is complete bollocks and you shouldn’t give a damn? No, I couldn’t be further from this. My point simply is that understanding how the work is done is crucial before you start messing with the process.

    As a rule of thumb, you can say that lower WIP and shorter cycle times are better, but only because so many companies have so ridiculous amounts of WIP and such insanely long cycle times that it’s safe advice in the vast majority of cases.

    If you are, however, in the business of making your team working efficiently, you had better start with understanding how the work is being done, as a single bottleneck can change the whole picture.

    One thought I had when writing this post was whether it translates to software projects at all. But then, I’ve recalled a number of teams that should think about exactly the same scenario. There are those which have the very same people dealing with analysis (prior to development) and testing (after development) or any other similar scenario. There are those that have a Jack-of-all-trades on board and always ask what the best thing to put his hands on is. There also are teams that are using external people part-time to cover for areas they don’t specialize in both upstream and downstream. Finally, there are functional teams juggling with many endeavors, trying to figure out which task is the most important to deal with at any given moment.

    So as long as I keep my stance on Kanban principles I urge you not to take any advice as a universal truth. Understand why it works and where it works and why it is (or it is not) applicable in your case.

    Because, after all, shorter cycle times and lower WIP limits are better. Except then they’re not.

  • The Kanban Story: Coarse-Grained Estimation

    Recently I told you what a screwed way we chose to measure lead time in our team. Unfortunately I’ve also promised to share some insight how we use lead times to get some (hopefully reliable) estimates. So here it goes.

    Simplifying things a bit (but only a bit) we measure development and deployment time and call it lead time (and don’t feel bad at all about that). So how do I answer to our customers when they ask me when something will be ready?

    That’s pretty easy. If we talk about a single feature and there is no other absolutely top priority task, I take a look at the board to track down a developer who will be first to complete his current task and discuss with him when he expects to finish it. Then I know when we can start working on the new, super-important feature ordered by the client. Then it’s enough to add two weeks (which is our average lead time) and make some effort to look oh, so tired as I’ve just completed such a difficult task of estimation. Oh, I need to tell the customer when they’re going to get the darn feature too, of course.

    This however happens pretty rarely. We try to keep our MMFs (Minimal Marketable Features) stick to their name which means they are usually small. This also means that described situations, when client wants just one feature from us, are pretty much non-existent. That’s why you might have noticed I didn’t take into consideration a size of a feature in described scenario. In the real life we usually talk about bigger pieces of functionality. What we do then is we split the scope into small MMFs and then use two magic parameters to get our result.

    One of parameters you already know – it is an average lead time. However there’s one more needed. It takes 13 days for the feature to get from the left to the right side of the board, but how many features are on the board at the same time? I took a crystal orb and it told me that on average we have 4,5 MMFs on the board. OK, I actually did a simple analysis of a longer period of time checking our completed MMFs and I got this result, but doesn’t a crystal orb sound so much better?

    Now, the trick I call math. On average we can do 4,5 MMFs in 13 days. Since I have, let’s say, 10 features on my plate I have to queue them. If I worked with iterations it would take 2,2 iterations (10/4,5) which basically means 3 iterations. But since we don’t use time-boxing I can use 2,2 and multiply it by 13 days of my lead time and get something about 30 days. Now I don’t start with empty board so I have to add some time to allow my team to finish current tasks. On average it would be half of lead time so we should be ready in, say, 37 days.

    And yes, this is rough estimate so I’d probably go with 40 days to avoid being blamed for delivering estimate which looked precise (37 looks very precise) but was just coarse-grained estimate.

    That’s basically what I went through before telling my CEO we’re going to complete management site for the product we work on in 3 months. Well, actually I didn’t told him yet, but 3 months there are. No less, no more.

    Although this post may look as it was loosely coupled with the Kanban Story it is definitely belongs there. So go, read the whole story.

  • The Kanban Story: Measuring Lead Time

    During AgileCE conference I had a discussion with Robert Dempsey about measuring lead time. I never really thought much about the way we count lead time in our team and talk with Robert triggered some doubts.

    What We Measure

    As you already know on our Kanban board we have backlog, todo queue, several steps describing our development and deployment process and finally done station.

    OK, so when do we stamp the starting date for the feature? We do it when the card goes from todo queue into design station, which is the very first column in our development process.

    When do we stamp ending date then? You may take your best guess and um… you’ll be wrong. No, not when the sticky note is moved to done column. Actually we mark ending date when a feature makes its way to live column which is third station from the right.

    And this is different from what you may have heard from Kanban gurus out there. Don’t blame me, I’ve already told you thought-leaders don’t know it all.

    What we measure is time which passes before we start actual work on feature to the moment it goes live.

    What We Don’t Measure

    What is left behind then? First and the most important thing is the time feature spends in todo queue waiting for some developer to become free and start working on it. If you were trained by the father of Kanban – David Anderson – you’ve probably heard something different but stay with me, I have a good explanation. Or so I guess.

    Another thing which is left outside is the last part of our process. There is documentation station where we (surprise, surprise) update documentation. This is done after pushing new version to production.

    It looks like we cut something on both ends to make our lead times look better, doesn’t it? Anyway what we gather as lead time doesn’t really describe time which passes from the moment of decision to build the feature to the moment it is done-done. Thus another question arises.

    Why, Oh Why?

    The way we measure lead time came in natural way but chat with Robert forced me to make some explanation up to justify our practice.

    Time Spent in Todo Queue

    We left time spent in todo queue out basically because content of this station is changing pretty often. Sometimes feature lives there just for a day or so just to go back to backlog when priorities change. And believe me they do change every now and then. Sometimes a feature stays in todo queue for a longer time as it is always pushed to the second or third place because, well, priorities change.

    There is another reason too. The basic reasoning for adding time spent in todo queue to lead time is that you should be able to tell your customer how long it would take from the day 0 (when they tell you they want the feature) to the moment they get it in production. It is pretty rare case when developers are able to start working on a new feature immediately so it is natural that some delay will appear when feature is waiting for a free developer.

    I’m not convinced though. Actually very much depends on additional circumstances. The feature the client is asking for may be the only high priority thing to do at the moment but it is pretty unlikely. If the client asks just for one feature lead time will be different than if they asked about a list of ten features. If you have limit of 3 in todo queue you would need to put 7 features in backlog anyway and time they spend in backlog won’t be measured.

    If you have a few clients and you need to balance your workload among them it becomes even more complicated since product owner (or whoever is your priority setter) has to decide which feature can be put on the top of the todo queue, which can occupy second or third place and which has to go into backlog.

    Basically in any situation but the simplest measuring time spent in todo queue wouldn’t help us much and that’s why we decided to exclude it from lead time.

    Time Spent on Documentation

    With documentation the situation is a bit different. Documentation isn’t a real part of our product. We create it for our internal reasons – to make life of our sys admin easier and to avoid problems if he was hit by the bus. This means that, from client perspective, our product is complete as soon as it goes live. Even though we have to do some housekeeping later it doesn’t affect our ability to deliver.

    Theoretically it might be a problem if documentation phase would be time-consuming and would steal time we’d prefer to spend for something else, namely deployment or testing. However looking at the past in the team it isn’t a problem so we may safely throw documentation out of lead time.

    The next thing is using lead time to create some estimates but that’s the subject for another post.

    If you liked this post you should like the whole Kanban Story too.