Tag: progress tracking

  • Making Use of Estimates

    I’m not a fan of estimation. I try to avoid it when I can. However, I’m not orthodox. I won’t be telling everyone that refusing to estimate is the way to go.

    I admit that I’m now in a comfortable land of time and material contracts that give more flexibility to the clients and more safety to the vendors at the price of mutual trust. At the same time Lunar Logic is the first of my jobs that works this way, so I’m more than familiar with fixed everything sort of contracts too. In that world estimate is a king. A lousy king though.

    Despite the fact, that fixed price projects are a nightmare from my past life, we can’t forget about estimation at all. Even those awesome folks we started working with recently started with asking us to deliver estimate in story points or other abstract measure of our choice.

    I intended to track progress in the project with Cumulative Flow Diagram (CFD) that counts only a number of tasks completed. However, having individual estimates for all the stories in backlog it’s easy to have two CFDs: one tracking a number of stories and tasks and the other that refers to initial estimates.

    One might suppose that it would be basically the same data on both charts. And one would be wrong.

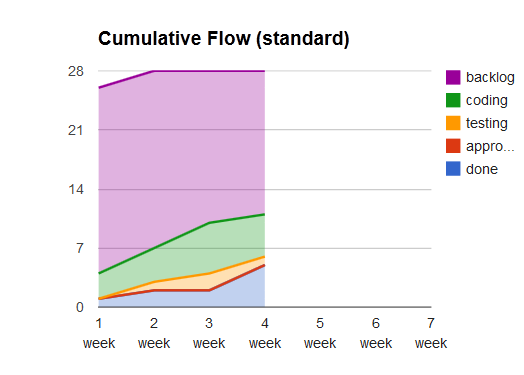
    Let’s start with the charts. Here’s standard CFD for the first few weeks.

    CFD

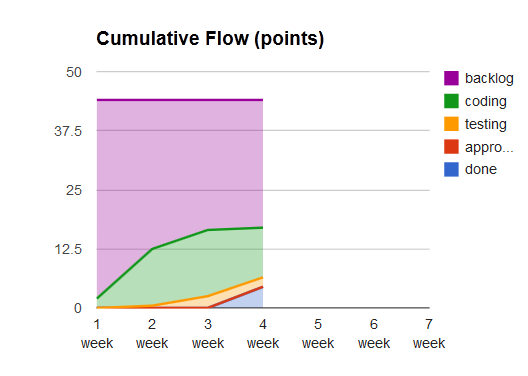
    And here’s CFD that bases on estimates in story points.

    CFD

    What’s the difference? In fact, there are quite a few of them.

    For the starters, the scope changed only on the first chart. What does it mean? Simply that despite no change in total points there were new tasks. In this case almost all of them were non-functional tasks like setting up the environment, design pre-processing and adjustments in existing code that enables integration with the new part of an application.

    There was also a split of one of stories to a couple of them for the convenience. The total estimate didn’t change although there was a new story to build.

    Another thing you may notice is that on the second chart we’ve finished anything pretty late in the project, while the standard CFD shows completion of a couple of features early. Again it is connected with non-value-adding and non-functional features that had to be completed to get the team running.

    Finally, and most interestingly, try to judge amount of work in progress and size of stories in progress looking at the charts. A hint: you will find the answer to the former in the first and to the latter on the second chart.

    Standard CFD tells you that we care about limiting WIP and avoid starting too much. The story point-driven chart shares a different story. Steepness of the coding curve indicates that we’ve started with heavy features. In this case heaviness was mostly driven by risks – the heaviest features were most risky ones. We decided to start with them to address risks pretty early in the process so if there’s a screw up on the way we know it as soon as possible.

    By the way, I don’t focus here on the data that you specifically get from CFD. You could draw exactly the same conclusions if you used burnup charts, which are gateway drug to Cumulative Flow Diagrams.

    Obviously, CFD can tell you a bit more, e.g. about the awesomeness of the client, as they don’t ever have anything stacked in approval. Whatever is ready it gets verified and accepted.

    Anyway, the point is that despite I don’t feel that detailed estimates in this project really pushed us further (maybe despite building trust relationship, but that’s a different story) we can still use the work invested in estimation to learn something.

    And, as you see, you can learn quite a bit using very simple tools.

  • Trap of Estimation

    So we had this project which was supposed to end by the end of July. Unfortunately a simple burnup chart, which we used to track progress, seemed rather grim – it was consistently showing very beginning of September as a completion date. A month late.

    Suddenly, one day it started looking almost perfectly – end of July! Yay!

    Wait, wait, wait. What? I mean, what the hell happened on a single day that we suddenly recovered from a month-long slip? Something stinks here.

    After a while of digging we came up with the answer. Actually team invested some time to re-estimate all the work, including the work which was already done. Now, how the heck does it affect burnup chart?

    It seems the chart on the y axis, where the work items were shown, had a sum of estimates and not just a number of tasks. It means that changing estimates in retrospect affects the scope and percent complete of the project. It actually means that such changes can affect predicted completion date as well.

    This is called creative accounting and some people went to jail because of that, you know.

    My first question is whether such re-estimation changes real status of a project in terms of how much functionality is ready, what is done, how many bugs are fixed or lines of code written or any other creative, crazy or dumb measure you can come up with to say how much work has been done. Or does it change how much more work is there to be done?

    No! Double no, actually. It’s just a trick to tell us we aren’t screwed up that much. Actually, I accept the fact that we might have been OK in the first place and the chart was wrong. That would be awesome. But fixing the chart in such way, one, doesn’t change the status of work in any way and, two, just covers the real issue so it is harder to address it.

    What is the real issue then? Well, there are a couple of them. First, using time-based estimates to show how much work is to be done is asking for troubles. Unless you are a freaking magician and you can make your estimates right 5 months before you even start working on the task, that is. If you’re just a plain human, like me, and you assume your estimates are wrong using them as a basis for tracing project progress seems sort of dumb to me.

    It would be much better to count features or, if they vary much in size, count weight of features. Say S size is 3 times smaller than M and this is 3 times smaller than L or something like this. By the way, as you gather historical data you can pretty much fix these factors learning from past facts.

    Second, even if you decided to go with estimates to judge how much work is to be done, what makes you thinking that fixing estimates in retrospect pushes you forward for an inch in terms of the next project you’re going to run? Do you expect to know exactly, in advance how much time will take you to build features in future projects? Because this kind of knowledge you’re applying now to “fix” your estimates in current project.

    I would rather prefer a discussion on how to judge the scope better at the beginning of projects because this is going to be your benchmark. In this case precise estimates are almost useless. I will likely be pretty close in terms of telling how many features we have to build. It’s going to be trickier to say which of them will be small, medium or large. But I refuse to guess how many freaking hours each and every feature will take to build because such effort is utterly futile. It just so happens that I’ve forgotten to take my damn crystal ball with me, so sorry, that’s not going to work.

    In this case estimation brings us to a trap. Knowing exactly how much time each work item has taken it is easy to track the progress in retrospect. Average 8-year old child would be able to connect the dots. However, unless you’re a bloody superhero and you’re going to have such data at the beginning of your next project don’t treat it as viable method of tracking progress.

    Use any data that will be available in high quality at the beginning of a project. Number of features, maybe sized in some way if your team have some experience in sizing and you understand variability of work.

    Anyway, whatever you do, just don’t change the benchmark in retrospect as it’s going to mess your data and cover a real problem, which is that you should improve the way you set the benchmark in the first place.

    By the way: if you happen to work on time and material basis you can perfectly ignore the whole post, you lucky bastard. Actually, I doubt you even reached to this point of the post anyways.