If you visit Software Project Management on occasions you likely know that 100% utilization is a myth. A nice and simple experiment that shows impact of full utilization on effectiveness and at the same time presents value of WIP limits is a ball flow game.
The rules are simple:
- You get a group of people to process 20 balls.
- Processing is just throwing a ball from one person to another.
- The person who starts throwing the balls in is also a person who is last to touch the ball.
- The ball should have at least minimal air time when changing its woner, i.e. it should be thrown not passed.
- Everyone in the group should touch each ball.
- The ball shouldn’t be thrown to any of two closest persons (the one on the left and the one on the right).
The rest is pretty much team’s self-organization.
The goal of the team is to process 20 balls as fast as possible.
The team can arrange themselves in a way that is convenient for them, which most of the time means standing in circle. Then they set up the sequence: who is throwing to whom. And then, the fun begins.
Following data is from the game I run with a group of 10 people.
The first approach was no WIP limits at all, meaning that balls were thrown in as soon as the first person was idle. With this approach it’s not even the data that is most interesting but the looks of what’s happening. Balls are flying all over the place. People barely cope with coordination of passing the ball to the next person and coming back to the previous one to receive the next ball. Pretty often balls are dropped and left forgotten as new balls are waiting. It’s all chaos.
And the clock is ticking.
Simply by looking at the situation you may safely guess it is suboptimal organization. However it is how many teams still work these days. We decided to use it as a reference point.
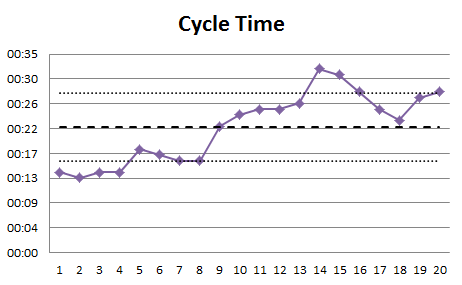
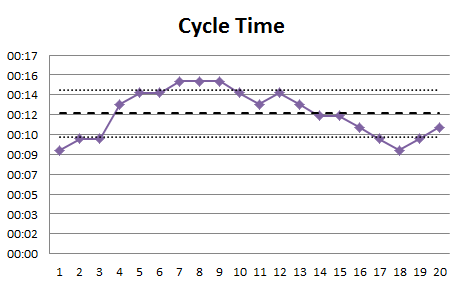
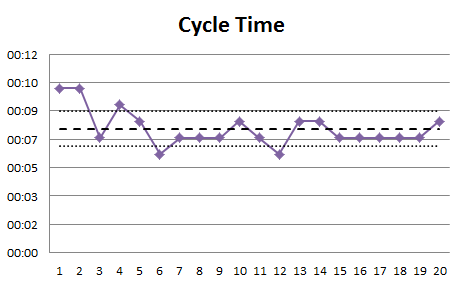
Cycle time for each processed ball looked like this.
One thing is that it could be as much as 32 seconds to process a ball. Almost 3 seconds per person for something as simple as passing a ball. Another thing is that variability of cycle times was high – anything between 13 and 32 seconds meant that worst case scenario was 2,5 times longer than the best case. This left us in a place when we were hardly predictable in terms of time needed to process the next ball.
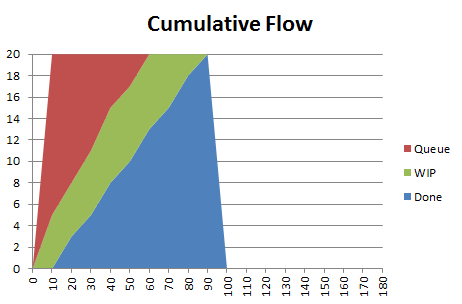
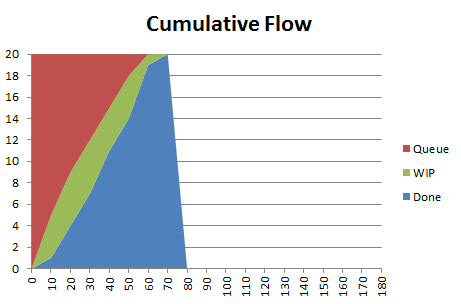
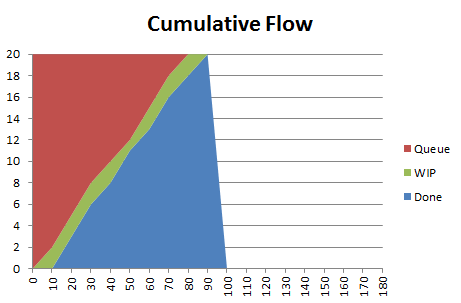
One quick look at Cumulative Flow Diagram (measures were taken every 10 seconds) will show one of typical problems I see in teams: as the project goes further cycle times become worse (green part of the diagram becomes wider).
Processing time of all the balls was 83 seconds.
With the second round the team decided to limit work in progress. With no idea what WIP limit they should go they decided to try WIP limit of 5 balls, for the team of 10 people. Considering that processing time was very short – no one was expected to do anything special with balls – the crucial thing were handoffs. In ideal case each handoff requires 2 people, one passing the ball and another one receiving it, thus limit of 5. It also meant that for the processing time one of every two persons will be idle.
First, the whole task was done in 63 seconds. Almost 25% improvement.
Second, the way the group worked looked way better. Little chaos, no dropped balls, no collisions in flight, etc.
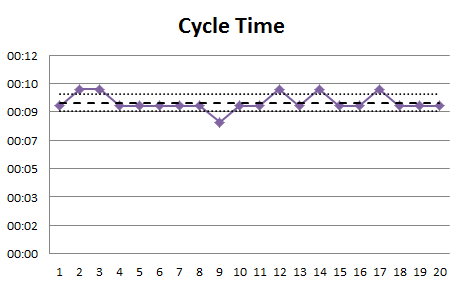
Third, cycle time went down and became more predictable. This time it was anything between 9 and 15 seconds. Yay! We shortened our time to market.
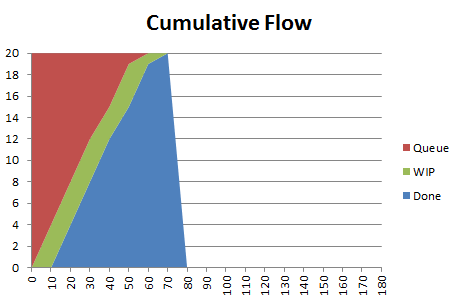
Cumulative Flow Diagram also looked better. Steeper curves mean better throughput and green part width (cycle times) are kept under control.
With such good results a natural consequence is a discussion about the optimum. We know that WIP limit of 5 is better than infinity but should we test WIP limit of 4 or rather of 6? The group decided to go with WIP limit of 4 in round 3 and results were interesting.
The end to end time was 61 seconds. Basically no change at all as I could potentially address 2 second difference to fluency with throwing balls.
Was it simply the same as in round 2 then? Pretty much the opposite.
The most interesting thing was what happened with cycle times.
There was only one ball that was processed faster than in 9 seconds, which was the best result in round 2. However this time variability of cycle times was reduced hugely (8 to 10 seconds). The team became highly predictable.
Considering that we were processing identical tasks, this was something we should expect, but it didn’t happen unless we introduced strict WIP limit. By the way, this predictability is neatly shown in CFD, which now looks very stable.
There’s one more thing hidden here too. With more strict WIP limit we introduced more slack time. This time, even in ideal situation when every ball is passed we still have two people idle. Yet the end effect is still the same. The difference is that this additional slack time can be invested to improve the process or automate the part of it so eventually the team becomes even more effective.
In short: considering that we have the same end to end team performance more strict WIP limit is better than looser one as it sets us on a better path toward improvement.
A natural next step would be probably trying WIP limit of 3. However having chance to play in controlled environment the team did an experiment with limit of 2 to see what would happen.
Basing on results so far outcome of round 4 could be somewhat predictable. Best cycle times went down even more with top result of 6 seconds.
However it came at cost of bigger variability as worst cycle time remained the same (10 seconds). We drove predictability down.
Cumulative Flow Diagram, again, looked neatly – nothing to worry about.
From CFD you can guess the key statistic here. Overall processing time went up. 85 seconds. A tiny bit worse than without limits at all.
However, again, comparing only rounds 1 and 4 I believe that the one with WIP limits is a way to go. Considering that the whole task was completed in the same time we had a lot of slack time that could be invested in improvements, there was less pressure and significantly less chaos. In other words: short-term results are similar, long-term ones should be better with WIP limits.
Now, why am I telling you all this? First, to show you the mechanism. You should be doing exactly the same thing with your real Kanban implementation tweaking WIP limits and measuring outcome of these changes to find local optimum.
Second, there’s underlying assumption made here. One that is super-important. You need to measure how you’re doing otherwise you won’t be able to tell whether after changes you are doing any better than you’ve done before. If you don’t have meaningful measures already in use then start with this, before you play with your WIP limits.
And now that you asked, no, I don’t consider your gut feeling “a measure.”
Big thanks to Karl Scotland, who I learned the idea from. If you want to play the game I strongly recommend using spreadsheets Karl kindly shared.
 Subscribe RSS feed
 Follow on Twitter
 Subscribe by email


2 comments… add one
When I last did this exercise rounds 1 & 2 were very similar to as you describe above. For round 3 though we tested the boundaries of the rules – we all stood close together in a tight circle, with hands outstretched palms up in the middle, one pair above another. A ball placed at the top can then drop down through the stack of hands, touching each on the way, until it hits the bottom and can be dropped into the receiving basket.
We basically arrived at continuous delivery and smashed our records for number of balls processed. Our limiting factor became getting balls back into the top of the stack.
Hi Pawel,
thanks for sharing this (and Karl to for the spreadsheets). I ran this yesterday (for a group of 5) and was also able to repeat the results you described. The most powerful element was the speed at which we could generate the data and discuss the results.
Thanks
Conor