Author: Pawel Brodzinski

  • Cumulative Flow Diagram

    One of charts that give you a quick overview of what’s happening in a project or product work is Cumulative Flow Diagram (CFD). On one hand in CFD you can find typical information about status of work: how much work is done, ongoing and in backlog, what is the pace of progress, etc. This is the basic stuff. On the other hand, once you understand the chart, it will help you to spot all sorts of issues that a team may be facing. This is where Cumulative Flow Diagram shows its real value.

    Before we move to all the specific cases let me start with the basic stuff though (feel free to scroll down if you’re familiar with this part).

    Cumulative Flow Diagram

    The mechanism of Cumulative Flow Diagram is very simple. On a vertical axis we have a number of tasks. On a horizontal one we have a timeline. The curves are basically a number of items in any possible state shown in a time perspective. The whole trick is that they are shown cumulatively.

    If the green curve shows stuff that is done it will naturally grow over time – that’s simple. If the blue line shows tasks that are in progress, and we have stable amount of work in progress it will still go up as it adds to the green line. In other words work in progress would be represented by the gap between the blue and the green lines… We’ll come back to that in a while.

    Any line on CFD represents a specific stage. In the simplest example we’d have items that are to be done, stuff that is ongoing and things that are done.

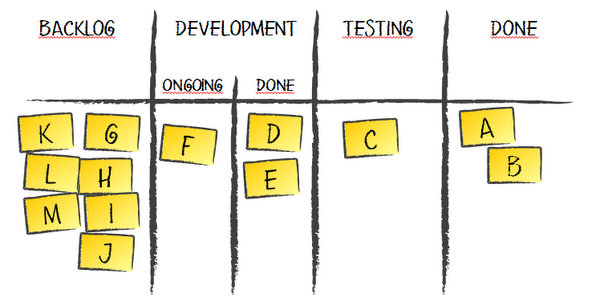
    For the sake of the rest of this article I’m going to use a simple process as a reference.

    Workflow

    We have a backlog, items that are in development or testing and stuff that is done. For the sake of Cumulative Flow Diagram examples it doesn’t matter whether tasks in development are ongoing or done and waiting for testing. However, as we will find later, there may be some indicators that would make tracking these two stages separately valuable.

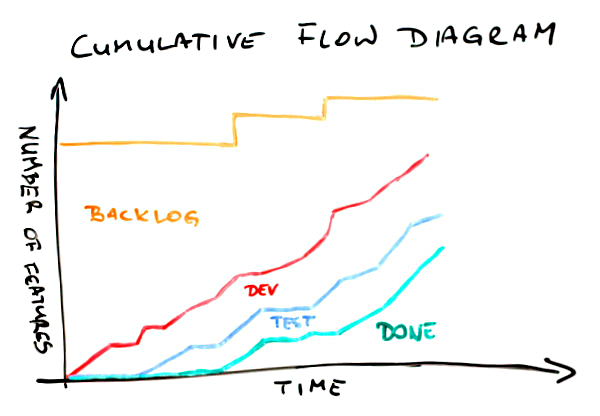
    With such a workflow our Cumulative Flow Diagram may look like this.

    Cumulative Flow Diagram

    First, the meaning of the lines. The green one shows how many items have been delivered over time. Everything that is between the blue and the green curves is stuff that is in testing. The area between the red and the blue lines shows how much stuff is in development (either ongoing or done). Finally, the top part below the orange line is the backlog – how many items weren’t yet started.

    In a glimpse we can find a few important bits of information about this project. First, after slow start a pace of delivery is rather stable. Pretty much the same can be said about work that is in progress – the pace is stable and things go rather smoothly. We know that the scope has increased a couple of times, which we can tell looking at jumps of the orange line. Finally, comparing where the green line (done) and the orange line (scope) are on a vertical axis right now we can say that we’re not yet halfway through the project.

    Quite a lot of information for the few seconds, isn’t it? Well, there is more.

    Cumulative Flow Diagram

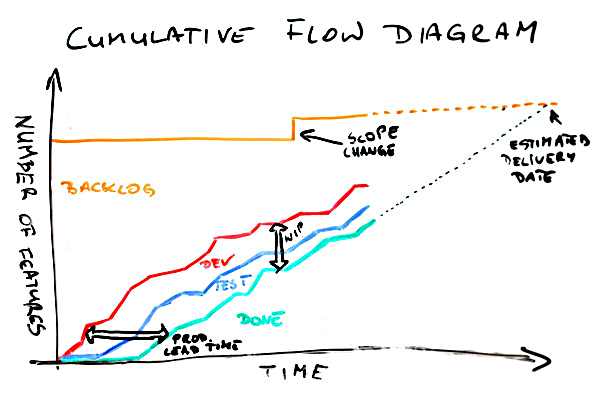
    On this CFD a few things have been shown explicitly. One is a scope change. We’ve discussed it on the previous chart too. Another one is the space between the red and the green lines. It represents work in progress (WIP). Note, basing on Cumulative Flow Diagram only you can’t learn how much work in progress you have precisely; it is some sort of approximation. Pretty good one, but only approximation. It is a very good indicator how WIP is changing over time though. There also is an arrow labeled “prod. lead time” where “prod.” stands for production. It roughly shows how much time we need to complete an item. Again, it shouldn’t be used as the ultimate lead time indicator but it shows pretty well what lead time we’ve had and how it changes over time. Finally, we can approximate slope of done curve to roughly estimate the delivery time. Of course if the scope changes the delivery time will change as well thus the scope line (the orange one) is also approximated.

    Now, we have even more information. Yay!

    You will rarely see such nice Cumulative Flow Diagrams though. And that’s good news actually. I mean if CFD looks plain and nice all the time you can only learn that much from it. The real CFD magic is revealed when things don’t go so well.

    Let’s go through several typical cases.

    Cumulative Flow Diagram

    In this situation the spread between the red and the green lines is growing over time. It indicates a really bad thing – we have more and more work in progress. That sucks. Increased WIP means increased lead time as well. Not only is time to market longer but also it is more and more difficult to deliver anything fast when we need it.

    That’s not the worst thing. The worst thing is that with increased amount of work in progress we also increase multitasking thus we incur all the costs of context switching making the team less efficient.

    Do we know that for sure? Um… no, not really. I make here an assumption that the team setup hasn’t changed, meaning that we have the same people spending similar amount of time on a project, etc. If it was Cumulative Flow Diagram for a team that is constantly growing and then it would be just OK. The chart may also present an increasing number of blocked tickets which definitely would be a problem but a different one then described above.

    In either case such a situation is a call for more analysis before jumping to conclusions. The potential reasons I offer you with this and following charts are simply the likely ones; not the only available.

    By the way, please treat all the following remarks keeping that in mind.

    One more interesting observation about this Cumulative Flow Diagram is that we have no clues where the root cause for increasing WIP lays. Neither development nor testing part seems to be steadily attached to any other line over time. A further investigation is a must.

    There are charts where we get some clues which stage of a process is problematic.

    Cumulative Flow Diagram

    Whoa, this time the development part compared to the testing part is really heavy. What can we learn from it? We don’t have problems with testing. Also, if a definition of testing is “testing and bug fixing,” which is a typical approach, it doesn’t seem that quality of work is much of an issue either. If we are to point fingers we’d point them to development part, wouldn’t we?

    And we might have been wrong. Of course one thing that may be happening here is a lot of items in development but few of them ready to test. Another issue though may be that there is a lot of stuff waiting for testing but availability of testers is very limited and when they’re available they focus on finishing what they started.

    How can we tell? We can’t unless we have more data. In fact, another line on the chart – one that distinguishes items in “development ongoing” from those in “development done” – would help. Without that the CFD is only an indicator of a problem and a call for a deeper analysis. After all, that’s what Cumulative Flow Diagrams are for.

    Another flavor of a similar issue is on the next CFD.

    Cumulative Flow Diagram

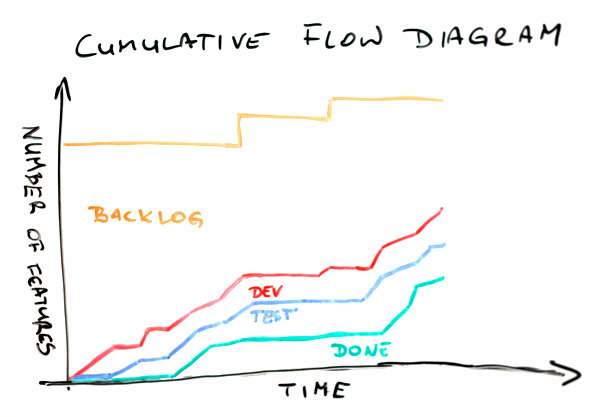
    We can find two things here. Let’s start with the more obvious one – the shape of the green line. It looks like stairs, doesn’t it? Stairs are typical when the last stage, which commonly is some sort of deployment, is done in cadences, e.g. weekly, biweekly, etc. Building on that, a stairs-shaped delivery line mean that work in progress and lead time would vary depending on a moment of release cadence you’re in. Maybe it’s time to make a step toward continuous

    There is one more thing here though. There is pretty significant, and increasing, number of items that are in testing but don’t get released. The gap between the blue and the green line is growing with each consecutive release.

    This one is a real issue here. It may mean that we have a problem with quality and we can hardly reach a state when an item has all the bugs fixed. It may mean that developers simply don’t pay much attention to fixing bugs but tend to start new stuff; at the same testers would follow up on new stories as they wait for bug fixes for the old ones anyway. It may mean that a code base is organized in a way that doesn’t allow releasing everything that is ready. Once again, the root cause is yet to be nailed but at least we know where to start.

    It seems we have more questions than answers. If you think that I’m not helping it will be no different with the next example.

    Cumulative Flow Diagram

    This would happen occasionally in almost every team. All the lines flatten out. What the heck? The first thing I do when I see that is I check for public holidays or company-wide event happening during that time. It may simply be time when no one was actually working on a project and there is a perfect explanation for that.

    Sometimes it is not the case though. This is when things get interesting. If everyone was at work but the chart still indicates that no one got anything done it most likely tells a story about serious problems. A staging environment could have gone down so everyone has been focusing on bringing it back alive. Another project could have needed help and virtually everyone has been sucked there. There could have been a painful blocker that has forced everyone in the team to refocus for a while.

    In either case, whatever it was it seems to be solved already as the team is back on track with their pace.

    Another flavor of such a scenario would look a bit differently. It would give more hints too.

    Cumulative Flow Diagram

    There are two important differences between this and the previous Cumulative Flow Diagrams. One is that, in this case, only two lines flatten out; the development line keeps the healthy progress. The other is that ends of both the green and the blue line are as flat as a table top.

    The latter suggests that whatever is the problem it isn’t solved yet. What the problem might be though? It seems that the team has no problem starting development of new items. They can’t, however, start testing, thus they clearly can’t deliver anything either. One of probable hypothesis would be that there is something seriously wrong with either the testing environment or the testers.

    In the first case it just isn’t technically possible to verify that anything works as intended. In the second it seems something bad happen to our only tester (if there were more than one there would likely be some progress). There is another hint too. Developers don’t seem to care. They just start, and possibly complete, their stuff as if nothing happened.

    I’d say that these guys have to deal first with the issue and then discuss how they collaborate. I sense a deeper problem here.

    The same way as the previous example indicates an issue in the way people cooperate, the next one suggest a quality problem.

    Cumulative Flow Diagram

    Development line goes up in a stable and predictable manner. The testing curve? Not so much. And we better not mention the done line. Obviously we have more and more work in progress here over time – we’ve covered this one before.

    But wait, then suddenly the magic happens and everything goes back on track. At the very end we have decently small amount of work in progress and much stuff delivered. The smell here is how the done (and testing to some point as well) curve skyrockets at the end.

    How come that earlier such pace was impossible? I’d challenge the idea that the team suddenly become so fast. Of course they might have not kept the board up-to-date and then, out of the blue, have realized that they’ve had way more finished items that they’ve thought they had.

    More likely scenario is that under pressure they just deployed whatever seemed at least remotely close to working. If that’s true the problem isn’t solved at all and it’s going to come back to bite them in their butt. A curious reader may try to draw a picture how further part of Cumulative Flow Diagram would look like in this case.

    The next one is one of my favorites. I wonder why it is so far down the list. Oh well…

    Cumulative Flow Diagram

    This Cumulative Flow Diagram is surprisingly common. Let’s try to list a few things that we can find here. The development curve goes up aggressively. Halfway through more than 80% of items are started. Testing doesn’t go nearly that well. And delivery? Well, the start was crappy, I admit, but then it simply went through the roof. And it isn’t only a single day that would suggest delivery of uncompleted stuff. Odds are that these items are properly done. Wouldn’t bet the real money on that but wouldn’t be surprised if that it was so either.

    Of course we have very high WIP in the middle of this CFD but at both ends the gap seems to be significantly smaller.

    Ah, one more thing. It seems that at the end of the day we’ve delivered everything that was in the backlog. Yay!

    Now, what would be the diagnosis in this case? Time boxing! This is one of classic visualizations of what typically happens over the course of an iteration. If a team is comfortable with planning and has rather stable velocity it’s likely that they’d fill backlog with reasonable amount of new features.

    Then, given no WIP limits within the time box everyone does their own thing: developers quickly start many features having no pressure other than the end of the iteration to finish stuff. Eventually, the backlog is cleared so the team refocuses to finish stuff, thus the acceleration at the latter stages of the process.

    If you pictured a series of such Cumulative Flow Diagrams attached one to another you’d see a nice chain going North-East. You’d find many of these in Scrum teams.

    Another chart, despite some similarities to the previous two, suggests a different issue.

    Cumulative Flow Diagram

    In this case almost everything looks fine. Almost, as the done line barely moves above the horizontal axis. However, when it finally moves it goes really high though. What does it mean?

    My guess would be that the team might have been ready with the stuff but, for whatever reasons, they wouldn’t deliver. In fact this is one of typical patterns in fixed price, fixed date projects, especially in bigger ones. Sometimes a basic measure that is tracked is how many items are done by the production team. No one pays attention whether it can possibly be deployed in production or even staging environment.

    Eventually, it all gets deployed. Somehow. The deployment part is long, painful and frustrating though. Cumulative Flow Diagram representation of that pain and tears would be that huge narrow step of the done curve.

    Talking about huge and narrow steps…

    Cumulative Flow Diagram

    Another chart has such a step too. We’ve already covered its meaning at the very beginning – it is the change of the scope. In this case it is not about the fact that such change has happened but about its scale and timing.

    First, the change is huge. It seems to be more than a half of initial scope added on the top of it. Second, it happens out of the sudden and pretty late in the project. We might have been planning the end date and now, surprise, surprise, we barely are halfway through again.

    Now, this doesn’t have to be a dysfunction. If you were talking with the client about the change or it is simply a representation of expected backlog replenishment that’s perfectly fine. In either case you it shouldn’t come as a surprise.

    If it does, well, that’s a different story. First, if you happen to work on fixed prices contract… man, you’re screwed up big time. It isn’t even scope creep. Your scope has just got on steroids and beaten world record in sprint. That hurts. Second, no matter the case you likely planned something for these people. The problem is it’s not going to happen as they have hell lot of work to do in the old project, sorry.

    So far lines on Cumulative Flow Diagrams were going only up or, at worst, were flat. After all, you’d expect that given the mechanism of creating the chart. That’s the theory. In reality a following chart shouldn’t be that much of a surprise for you.

    Cumulative Flow Diagram

    Whoa! What happened here? A number of stories in testing went down. The red line representing stuff in development followed but don’t be fooled. Since the gap between the red and the blue line is stable nothing really happened to the items in development; it’s only stuff in testing that was affected.

    Now, where did it go? Definitely not to done bucket – the green line didn’t move. It didn’t disappear either as the total number of items (the orange line) seems to be stable. A few items had to go from testing to backlog then.

    What could it mean? Without an investigation it’s hard to say. I have good news though. The investigation shouldn’t be long – such things don’t happen every other day. For whatever reasons stuff that was supposed to go past code complete milestone was marked as not started.

    I sense a major architectural or functional change. What’s more, it’s quite probable that the change was triggered by the tests of aforementioned items. Unfortunately it also means that we’ve wasted quite some time building wrong stuff.

    Another flavor of that problem looks a bit scarier.

    Cumulative Flow Diagram

    Again, the total scope didn’t change. On the other end every other line took a nosedive. Once again amount of stuff in development doesn’t seem to be affected. This time the same can be said about items in testing. It’s the delivered stuff that got back to the square one.

    It means that something that we though was done wasn’t so. One thing is that we were building wrong stuff, exactly as in the previous example, only we discovered it later. We likely pay the order of magnitude bigger price for the late discovery.

    There’s more in it though. This Cumulative Flow Diagram shows that we likely have problems with acceptance criteria and / or collaboration with a client. I mean how come that something that was good is not so anymore? Either someone accepted that without checking or we simply don’t talk to each other. No matter the case it sucks big time.

    Would the orange line never move down then? Oh yes, it would.

    Cumulative Flow Diagram

    I mean, besides an obvious case where a few items are removed from backlog and the only line that moves down would be the orange one, we may find this case. Using the technique perfected in the previous examples we will quickly find that a few items that were in testing are… um, where they are actually?

    Nowhere. They’ve disappeared. They haven’t been completed, they haven’t been moved back. These items are no more.

    What does it mean? First, one more time we’ve been working on wrong stuff (fools we are). Second, we’ve figured it out pretty late (but could have been later). Third, the stuff doesn’t seem to be useful at all anymore.

    It’s likely that we realized that we don’t know how exactly build this or that and we asked the client just to learn that they don’t need either of those anymore. It’s also likely that we’ve encountered a major technical issue and rethought how we tackle the scope possibly simplifying the whole approach. Whatever it was, if we had figured it out earlier it wouldn’t have been so costly.

    Finally, one more Cumulative Flow Diagram I want to share with you.

    Cumulative Flow Diagram

    Think for a while what’s wrong with this one.

    When compared to the previous charts it seems pretty fine. However, by now you should be able to say something about this one too.

    OK, I won’t keep you in suspense. In the first part of this CFD work in progress was slowly but stably growing. However, it seems that someone noticed that and the team stopped starting new stuff. You can tell that seeing how relatively flat the red line has become somewhere in the middle of the chart.

    Given some time testing and delivery, even though their pace hasn’t changed, caught up. Work in progress is kept at bay again and the team’s efficiency is likely improved.

    As you can see, despite past several examples, you can see the effects on improvements at Cumulative Flow Diagrams too. It’s just that CFD is more interesting in terms of learning that you have a problem than finding confirmation that you’ve solved it. The latter will likely be pretty obvious anyway.

    Congratulations! You made it through to what is probably the longest article in the history of this blog. Hopefully you now understand how to read Cumulative Flow Diagrams and what it may indicate.

    I have bad news for you though. You will rarely, if ever, see such nice CFDs as shown in the examples. Most likely you will see an overlapping combination of at least a few patterns. This will likely make all the lines look like they were tracing a rollercoaster wagon.

    Fear not. Once you get what may be happening under the hood of the chart you will quickly come up with the good ideas and the right places to start you investigation. After all, Cumulative Flow Diagram will only suggest you a problem. Tracking it down and finding an antidote is a completely different story.

    However, if you’re looking for a nice health-o-meter for your team Cumulative Flow Diagram is a natural choice.

  • Kanban Landscape and Portfolio Kanban

    One of reasons why Kanban Leadership Retreat (KLRAT) is such an awesome event is that it pushes our understanding of Kanban to a new level. No surprise that after the retreat there’s going to be much content related our work in Mayrhofen published here.

    One of sessions was at KLRAT was dedicated to sort out the Kanban landscape – how we position different Kanban implementations in terms of both depth and scale.

    Here’s the outcome of the session

    Kanban Landscape

    To roughly guide you through what’s there: the axes are maturity and scale. Maturity would differentiate implementations that are shallow and use only parts of Kanban from those that are characterized by deep understanding of principles and practices. Scale, on the other hand, represents a spectrum that starts with a single person and ends with all the operations performed by an organization.

    If we use scale as staring point we would start with Personal Kanban. If you ask me I believe that the range of depths of Personal Kanban applications should be wider (thus a bit taller area highlighted on the following picture), but I guess it’s not who should take the stance here.

    Kanban Landscape Personal Kanban

    Then we have the whole lot of different Kanban applications on a team and a cross-team level. For most of attendees this was probably the most interesting part and I guess there will be much discussion about this part across the community.

    Kanban Landscape Team Level Kanban

    For me though a more thought-provoking bit was the last part (which by the way got pretty little coverage in discussion): Portfolio Kanban. After all, this is my recent area of interest.

    Kanban Landscape Portfolio Kanban

    Since we didn’t have enough time to sort out all the details during the session the final landscape was a sort of follow-up. Anyway, my first thought about the whole picture was that the range of depth of Portfolio Kanban implementation should be broader.

    Given a simple fact that limiting work in progress on portfolio level is tricky at best, many teams start simply with visualization. Of course I don’t have anything against visualization. In fact, I consider visual management, which is implementation of the first Kanban practice, a tool that allows harvesting low-hanging fruits easily. In terms of improvements on portfolio level low-hanging fruits are rarely, if ever, a scarce resource.

    Having said that, Portfolio Kanban or not, I don’t consider visual management a very mature or deep Kanban implementation. That’s why my instant reaction was that we should cover less mature implementations on portfolio level too.

    Kanban Landscape Portfolio Kanban

    That’s not all though. When we think about shallow Portfolio Kanban implementations, e.g. visualization and not much more, we should also think about the scale. It’s a quite frequent scenario that we start visualizing only a part of work that is done across the organization, e.g. one division or one product line. From this perspective, such implementations are closer to multi-service scale than to full-blown portfolio context.

    That’s why I believe Portfolio Kanban implementations should cover even broader area, especially when we talk about low-maturity cases.

    Kanban Landscape Portfolio Kanban

    Finally, the picture would cover different Portfolio Kanban implementation I know. I guess this might mean that, in some point of future, we will go into more detail talking about maturity and scale of Portfolio Kanban implementations. However, as for now I think it is enough.

    Interestingly enough the area I propose for a portfolio level implementations covers much of whitespace we’ve had on the picture. It is aligned with my general perception of Kanban as a method that can be scaled very flexibly throughout the broad spectrum of applications.

  • All Sorts of Kanban

    Some of you who pay more attention to what is happening in the Lean Kanban community may have noticed that there’s an ongoing discussion about what Kanban is or should be. It’s not about what do we use Kanban for but how exactly we define Kanban.

    Another incarnation of this discussion was started by Al Shalloway with his post on how he typically approaches Kanban implementations and the explicit statement that he doesn’t support Kanban method anymore.

    Al Shalloway Kanban

    Obviously it sprung a heated discussion on Twitter, which is probably the worst possible medium for such a conversation. I mean how precisely can you explain yourself in 140 characters? That’s why I didn’t take part in it. However, since I do care about that here is my take on the whole thing – not just Al’s comments but the whole dispute altogether.

    Let me start with the very old discussion about Scrum. I’ve always been a fanboy of ScrumBut. In fact, all sorts of ScrumButs. Not that I don’t see risks attached to using only part of the method (but that’s another story). I just think that any method is some sort of generalization and its application is contextual. It means that specific implementation has to take into account a lot of details that were simply not available or known when the method was defined.

    Fast forward to the discussion around Kanban. My general attitude hasn’t changed. When I see more and more different approaches to Kanban adoption I have the same feelings as I had when I’ve seen people experimenting with different Scrum implementations. The more the merrier.

    I totally respected, and learned from, the discussion about different order of adoption of Kanban practices that happened last year at Kanban Leadership Retreat. I totally respect, and learn from, Al’s approach as well. There’s no single flavor of Kanban.

    The part I don’t respect is dissing other approaches to Kanban adoption. If we want to discuss why something works or doesn’t work let’s do that in a specific context. I guess we will quickly find out that different approaches are valid in different contexts.

    So what is the definition of Kanban? Personally I base on the definition of Kanban method as described in David Anderson’s book (including all the later work that will hopefully make its way to the second version of the book). From my experience it is the most commonly used and most widely known. It is also covered extensively with experience reports and derivative work. So if we look for a benchmark, something we universally refer to when talking about Kanban, I think we already have one.

    At the same time I’m perfectly OK when I see other flavors of Kanban. As far as we understand the method, why specific practices are there, we can start tweaking it so it fits our specific context better. This is exactly what is happening with Kanban these days. And my take is that it is still the same Kanban, no matter whether one prefers interpretation of David Anderson, Mary Poppendieck, Henrik Kniberg, Hakan Forss, Al Shalloway or someone else (we’ll see more of those, I’m sure). I’m OK with that, no matter that personally I have my preferences across the list.

    There are different sorts of Kanban and that’s actually the best part. There is no one-size-fits-all approach and there never will. It is always contextual. And this is why we need diversity.

    Personally, I’d love to see these discussions run in such a spirit and not following the “my way is better than yours” line.

  • Kanban Leadership Retreat: Portfolio Kanban

    This year’s Kanban Leadership Retreat (KLRAT), as always, was awesome. In fact, despite sharing some critical feedback during retro session at the very end of the event, I still consider it the best event of the year, hands down. This year I’ve come back home with the biggest homework ever: experiments to try out, ideas to play with, concepts to write down, etc. It means that coming back next year is a no-brainer to me.

    One area that you’ll hear a lot about here is Portfolio Kanban. And this was also the subject of my session at the retreat.

    The Goal

    One of my goals for KLRAT this year was pushing forward the discussion on Portfolio Kanban. Answering questions like: what are the boundaries of the method? What are the gaps we still need to cover to make Portfolio Kanban thorough? How the implementations on portfolio level are aligned with the method as we know it?

    During the session I wanted to talk about all these things. My expectation wasn’t to rule out all the doubts. I assumed that the outcome would include some answers as well as some new questions but overall would bring us to better understanding what Portfolio Kanban is.

    The Hypothesis

    I hypothesized that Kanban method with its principles and practices define well the approach we can use on portfolio level. In other words that we don’t need any other definition for Portfolio Kanban than the one we already have for Kanban. This is where we started.

    The Process

    I didn’t want to start with the Kanban definition and look for its possible applications (we would find those, wouldn’t we?). I asked participants for a brain dump practices, actions and techniques that we use manage portfolio. Then we sorted them into six buckets of Kanban practices. For example portfolio overview would be covered by visualization so it went to the visualize bucket, limiting number of ongoing projects would obviously go to the limit WIP bucket, etc.

    Of course there were odd balls too. These went to the side as another group. Actually, this one was the most interesting one for me as they pointed us to possible gaps.

    Everyone had a chance to briefly explain what they put on the wall and why it went to a specific bucket. Then we used the remaining time to discuss the challenges we see – which questions weren’t addressed and need further work.

    The Outcomes

    There are a few lessons learned from the exercise. I think the most important bit is that the hypothesis was confirmed. I am convinced that using constraints of Kanban method we can neatly define Portfolio Kanban.

    Of course the specific techniques will be different. Interpretation of practices will vary too. But the same is true with team level Kanban applications in different contexts.

    Things get more interesting once we go deeper into the details. Let’s look at the wall which is the documentation of the session (click for a larger version).

    KLRAT Portfolio KanbanKLRAT Portfolio KanbanKLRAT Portfolio Kanban

    After a glimpse you can see that one bucket is almost empty. Surprisingly enough is the improvement / evolution bucket. Does it mean that we don’t see a match between Kanban method and portfolio management in this aspect? Personally, I think that it would be too quick to draw such conclusions.

    An observation made by Klaus Leopold was that quite a bunch of the stickies on the wall that could be placed not only in their original place but also in the improvement / evolution bucket. That’s obviously true. But then I can’t help but thinking that if we were doing the very same exercise with Kanban on team or service level the end result would look different.

    I think that the answer is that evolution on a portfolio level involves different behaviors and different tools than on a team level. How exactly? Well, this is one of these loose strings we have after the session, so I don’t have an answer for this. Yet.

    Finally, pretty obvious outcome of the session is the list of the challenges we will have to address (or explicitly leave unaddressed) to finalize definition of Portfolio Kanban

    KLRAT Portfolio Kanban Challenges

    Although we aren’t there yet in terms of defining what Portfolio Kanban is going to be, we made a big step forward. And this was exactly what I wanted to achieve. I didn’t want more divergence as I believe we’ve had enough of that so far. I didn’t expect more convergence either. Not just yet. Also I think that the time at KLRAT is just too scarce to spend it discussing the exact definition.

    And that is how the end result of our work looked like.

    KLRAT Portfolio Kanban

    All in all there are going to be follow-up steps – those that will bring convergence. If you are interested in further work on the subject stay tuned.

  • Manager-Free Organization

    One of frequently mentioned management ideas these days is that we don’t need management. If I got a free beer every time I’ve heard the examples of W.L. Gore, Valve or GitHub and how we should act as they do I could stay drunk for weeks without needing to buy any alcohol. A common message is that if they can everyone can.

    I don’t subscribe to that idea.

    Well, being a manager myself that’s not really a surprise, isn’t it?

    I mean I’m really impressed with what these companies do, especially W.L. Gore given its size. It doesn’t mean that I automatically think that it is the new management model that masses should adopt. I simply don’t treat is as the true north of management or leadership if you will.

    First, such an approach is very contextual. You have to have a lot of right bits and pieces in place before it works. For the start it will fail miserably unless you have the right people on board and, let’s face it, most companies have way too many bad apples to make it work.

    Second, scaling up a manager-free organization is a huge pain in the neck. This is why I respect so much W.L. Gore work.

    Being a fan of evolution I also try to imagine how to become such an organization evolutionary. I guess I must be too dumb but in vast majority of companies it is beyond my imagination. Revolutions, on the other hand, have surprisingly crappy success rate so that’s not a feasible solution either.

    So far you might have considered me as a skeptic.

    Well, not really.

    While I don’t think that the managerless approach is, or will be, for everyone there is a specific context where it is surprisingly easy to implement. If you run a small company, let’s say smaller than 30 people, there’s not that much of managerial work anyway. Unless you introduce tons of that crap, that is.

    It just so happens that Lunar Logic is such a small company. When you think about small and stable size you can forget about scaling issue. It is much easier to find the right people too because you simply need fewer of them. While Valve needs few hundreds of them we’re perfectly fine with twenty-something. Besides, smaller teams generally tend to have fewer bad apples as everything, naturally, is more transparent. Everyone knows everyone else, sees others’ work, etc. There’s no place to hide.

    Suddenly, the manager-free approach doesn’t seem so scary, does it?

    It may be a hit for managers’ ego though.

    I can hardly remember when I wasn’t a manager. Obviously there were countless occasions when I used my formal power to do what I believed was right. So yes, it took courage to intentionally strip myself off of power and just put myself in a row with everyone else. Not that I’m already done with that; it’s a gradual process. A nice thing is that it can be done in evolutionary fashion though.

    While I still make salary and some other financial decisions, that’s basically it. The good part is that I’m forced to wear my manager’s hat very, very rarely. I spend the rest of my time fulfilling all the other roles I have which hopefully can be summarized as me helping others.

    You know, all the fun stuff, like setting up daily conference calls with the clients, writing longish boring emails, keeping task boards up to date, solving mundane problems, etc. Typically, just being there and looking for ways to help the rest of the team doing their best. An interesting thing is it does feel damn good even if the tasks sound less-than-exciting. I help people to do their awesome job. What else could you ask for as a leader?

    That’s why I can’t be happier when I witness others treating me just as a regular team member. It means we are closer to being a manager-free organization.

    So while you shouldn’t expect me proposing the managerless office to everyone I definitely thing that this is something small, knowledge-based companies could try.

    Would it work that easily if we were twice as big? I have no freaking idea. I mean we definitely aren’t yet where GitHub or Valve is. I don’t even know if we want to be there. If the company’s growth is a threat for the culture we grow and cultivate here, so much the worse for the growth.

    And this basically summarizes why I think that the manager-free approach isn’t for majority. I think pretty few businesses would prefer to sacrifice growth just for the sake of preserving the culture.

    By the way, do expect more on the subject soon.

  • MVP Thinking

    One of the most valuable goals achieved by Eric Ries’ Lean Startup is popularizing the term Minimal Viable Product (MVP). Of course the concept isn’t novel. We were using the Minimal Marketable Feature (MMF) idea back in the early days of Kanban and it was coined based on the same way of thinking. There are more of such concepts too.

    The basic premise is that we should build the smallest possible thing or run the smallest possible experiment that is still reasonable and adds value. Depending on the context the value may be something that helps users, but may as well be just knowledge discovery or verification a hypothesis.

    One thing I’ve realized recently is how widely I apply this thinking. Initially, it was simply the way of breaking the scope down. I wanted my teams to build possibly small, but still valuable, chunks of software so a client can verify them and feed us back with useful information. Then, after Lean Startup, it was about running a product. What we want to build something new that kicks butts. What is the smallest feature that can prove or disprove the hypothesis that it would work at all?

    Somehow I now use the same way of thinking, MVP thinking if you will, to discuss marketing ideas, define actionable items during retrospectives, etc. Often it is difficult to define a product per se, but there always is some kind of an expected outcome and definable minimal effort allowing the get that outcome.

    So how would I define MVP thinking?

    1. Define the next smallest valuable goal you want to achieve.
    2. Define minimal effort that allows you to achieve that goal.
    3. Execute.
    4. Analyze the outcomes and learn.
    5. Repeat.

    A potentially tricky part here is defining the goal because it is totally contextual. It is also something that really appeals to me as I don’t like recipes. In fact, if there is anything new here it is basically extremely broad application of the pattern as the idea itself is anything but new. I mean, we usually close our context to working with the scope of a project, driving a product, running a business, etc. Then, we absolutely coin a new term and if it works we make our careers as overpriced consultants.

    That’s totally not my goal. I’m just trying to broaden an applicable context of ideas we already know as I’ve personally found it helpful.

    So if my problem is a roof leaking near a roof window my next minimal goal may be verifying whether the leakage has anything to do with an external window blind. Such a goal is nice because minimal effort may mean simply waiting for the next rain with the blind either opened or closed. I definitely don’t rush to repair the roof.

    Talking about marketing? Let’s set a general goal that, say, TechCrunch will cover us. What would be the smallest valuable experiment that can bring us closer to achieving this kind of a goal? I guess reaching out and networking may be a very reasonable first step. It doesn’t even require having an idea, let alone a product, that we want to have covered.

    How about a product? Well, this one was covered virtually everywhere. Building minimal functionality, possibly even fake, that allows verifying that the idea for the product makes sense.

    Retrospectives? What is a single, smallest possible, change that will have a positive impact on the team? Try it. Verify it. Repeat.

    Heck, I even buy my sailing gear this way. What is the smallest possible set that allows reasonable survival? Then I use the outcome and iterate, e.g. next time I need new gloves, long johns and waterproof case for a phone.

    When you think about that it is basically Kaizen – systematically running small improvement experiments everywhere. So yes, it’s nothing new. It’s just the specific idea of Minimal Viable Product that spoke to me personally and gave me a nice constraint that can be used in different areas of my life.

    By the way, despite it very open definition I also find Kaizen usually applied in a very limited context. So no matter which idea works for you, just remember you can use it in broader context.

  • Hire the Best

    I took a part in a panel discussion at GeeCON about presence of women in IT industry. One of my arguments on why we should hire more women sprung an interesting comment:

    I can’t agree with ‘hire woman even if she is a worse candidate’

    Pawel Wrzeszcz

    In fact, I’d agree with such a statement. I would as I wasn’t proposing hiring worse candidates. What I was pointing out was that I would hire less skilled or less intelligent woman over man. Why? Simply because she would be a better candidate.

    Now, you may be confused so let me point two things. A typical hiring process is about individual traits. How much a candidate knows, what skills or traits he or she possesses, etc. Then, once we hire them, we put them on a team where key things are how one acts as a part of the team and how they help the team to get better. A very different thing.

    If something I need to make my team more effective is more empathy and a different cognitive style I’d do the right thing focusing on these characteristics (which, by the way, promotes women over men). What almost all hiring managers would do instead they’d hire the best possible coder (which typically promotes men over women). Was he the best candidate?

    On some accounts, I guess…

    Let me rephrase: was he the best candidate in that specific context?

    Definitely not.

    He might have been most skilled and most intelligent candidate, which doesn’t make him the best. Not even close.

    If sport teams had the same hiring strategy as we do in IT industry they would be hiring only people for one position, possibly only stars. Can you imagine a football team (proper football, not American one) with 11 world class forwards?

    Yes, this is a dream of many hiring managers in IT.

    We forget that building software in vast majority of cases is a team sport, not an individual effort. And we don’t get points for having the most awesome person on the team but for what the whole team has achieved.

    So my challenge here is to rethink what “the best candidate” really means. We should be thinking more in terms of improving our teams, which is was more than simply hiring the most skilled person at hand.

    Hire the best still stands true, but we should first answer the question: the best for what?

  • What Makes Teams Better

    I’ve heard these experience reports a number of times: when a woman joins a team the whole team dynamic changes. Usually there is sense of improvement in team performance too. Unfortunately, most teams I know couldn’t report measured improvement as they didn’t have reliable measures in place. Anyway, the experience is very consistent.

    It is, unless we talk about a pure-male team that simply rejects any woman who joins. And does that a few time in a row. I know such teams too but I consider them dysfunctional.

    Anyway, let’s put dysfunctional groups aside. My own experience is purely positive too. I mean anytime that a team gained a new female member it was an improvement. At least that’s how I felt.

    Interestingly enough, it’s not about having a woman in a team. It’s about having as many of them as possible. The research done by Anita Woolley shows that the more females in a team the better collective intelligence of this team is.

    At the same time, the same research shows that collective intelligence beats the crap out of individual intelligence. Even more so if our goal is finding solutions of complex problems. And I dare say that software development is exactly that – solving complex issues – so we should be focusing on collective intelligence, and not individual traits.

    Collective intelligence was much more predictive in terms of succeeding in complex tasks than average individual intelligence or maximal individual intelligence

    Anita Woolley

    This changes my perception of recruitment. I was always saying that given two candidates who are on par I’d hire a woman, not a man. Taking only individual perspective into account, that’s just about right. However, when we think about teams the equation is different.

    In this equation women beat men easily.

    The big question is what are you going to do with this?

    Personally, I know what experiment I’m going to run next. And yes, it has a lot to do with hiring. I wouldn’t use the word “parity” but it wouldn’t be improper either. We need (even) more women on bard.

    I do want my teams to kick butts. How about you?

  • It’s the People, Not the System

    When I first learned about the D. Edwards Deming’s idea that 95% of performance should be addressed to the system and only 5% to the people it seemed totally counter-intuitive to me. Not even the idea itself, but its consequences. I mean a simple thought that you can basically stop working individually with the people on their performance as it just doesn’t make any sense. The impact of suboptimal system improvements should be tenfold or better than the best possible people-related changes.

    Then, after researching the subject a bit, I swayed to the other side. The examples shared by Deming or Eli Goldratt are undeniable. I can also find a lot of examples from my own experience how the system was impacting performance heavily. Not that I had the numbers, but it resonated well with me.

    Now, finally, you know what I think? Both approaches are crap.

    Yeah, I’ve just tried to piss of both: guys who strongly believe in Deming’s work and those who totally disagree with him with a single attempt.

    What Deming Really Said

    I guess this story started when I was looking for precise Deming’s quote on one occasion. It seems that the meaning people attach to his words wasn’t there initially. The original 95/5 thingy was not about performance literally but about variability in performance.

    Let me use a sport analogy to explain that. Let’s take a basketball player. If he scores anything between 5 and 30 points a game, and neither of extremes is an extraordinarily good or an extraordinarily bad game for him (meaning: it happens on occasions) variability of his performance is high. As a comparison we can have another guy, a second-tier player, who regularly scores anything between 0 and 5 points. Variability of his performance is significantly lower, even though his average performance is significantly worse.

    Now, it’s not a surprise that the system governs variability. I mean, the more repeatable the situation the less variability you can expect. If the team plays are consequently set to create situations for one player his performances will be sort of repeatable. He won’t be suddenly disappearing from the game. At the same the system also governs variability of performances of a role-player who joins the game only under special circumstances, e.g. when the team needs more three-pointers or maybe when one of important players is injured. Variability of performances of such a player will be significantly bigger.

    Of course, to some point, the system also governs performance itself. Think what happens when the star sits on the bench throughout the whole game or when a guy who is typically a sub plays the whole game. It doesn’t mean, however, that you tell a third-tier player to substitute a team leader and expect them to score 30 points a game. It’s not going to happen in a consistent manner. (For basketball fans: yes, I know Jeremy Lin’s story, but that’s an exception.)

    What Deming was talking about was basically that the system governance is responsible for creating a stable and repetitive environment so people performances are controllable. Again, it’s not about how exactly people perform, but how their performance varies from day to day.

    In fact, the above statement is mostly an interpretation too. Deming was talking about the system being, or not being, in statistical control which isn’t exactly performance variability, but for the sake of this argument let’s leave it as it is and not complicate things even further.

    Anyway, Deming Is Still Wrong

    So far I made an attempt to convince you that: first, Deming was basically talking about performance variability and second, the impact of the system on performance itself, while existent, isn’t anywhere close to 95%.

    However, we shouldn’t forget Deming’s background, which is a factory floor. In other words it’s a place where workers are supposed to produce same things in a repeatable manner. I could exploit the basketball analogy further pointing that every game, heck, every play is different, but I guess in software development we simply don’t need that analogy anymore. It’s enough to ask: how many times have you built exactly the same feature?

    And for all three of you who accidentally had this chance: how many times have you built the feature second time in exactly the same way you did the first?

    I bring this argument to show that in knowledge work, or sports, we naturally have significantly higher variability to deal with. And, unlike on a shop floor, that is good. What’s more, there is a different value attached to every single thing we develop. In fact, it’s even worse than that. Very often we don’t know exactly what value is attached to a work item we’re going to build.

    This means that in such a situation we should use a very different statistic mechanism than Deming based on. We need to take into account both expected cost and expected payoff. The latter, naturally, isn’t taken into consideration on a shop floor as in this situation payoff for each part is well known. In knowledge work, on the other hand, payoff function is extremely important and never flat.

    Coming back to the basketball analogy: if you wanted to bet which player is going to score 30+ points during the next game would you rather choose this reliable guy who averages 15.0 and who always scores double-figure but rarely, if ever, exceeds 20.0 or rather that crazy shooter who (surprise, surprise) averages 15.0 as well but, depending on a day, can score either nothing or 40+ points? Bravo! You’ve just chosen higher variability, which is totally against what Deming taught us.

    This is because you’ve taken the payoff into account. In the former case any payoff is almost impossible as, because of low variability, it’s highly unlikely that the guy is going to score 30+ points. The other case is a different story though.

    Now, especially when we think about product development we are in a betting business. We bet that this or that feature will bring a ton of new users or a truckload of money. We can’t ignore the payoff function. We can’t assume the payoff function is flat. In either case we’d be throwing the baby out with the bathwater.

    By the way, if you want to dig deeper around this one I strongly recommend watching this Don Reinertsen’s session. Twice. Seriously.

    Besides, Who Does Create the System?

    I’m not done yet. I don’t challenge the idea that the system affects performance. I simply challenge the so-called 95/5 rule or, to be more precise, I challenge the way some people interpret the so-called 95/5 rule.

    The question we should be asking is who (co-)creates the system. If we start with Deming he points shaping the system as a management responsibility. This is probably very true on a factory floor. We are not at a factory floor though.

    Let’s stay for a moment within software development perspective and think what exactly an equivalent of a production line is.

    Obviously, one part would be organizational culture. What are general ways things are done in the organization? Does the org use a lean / agile or rather a heavy-weight, formalized approach? How do your clients act? These general rules will be difficult to change.

    However, when we consider a lower level it’s a different game. Let’s try to translate low-level manufacturing process to software development. Production line would likely be a sort of a process: analysis, coding, testing, deployment, etc. What’s interesting though is what is happening on each of these stations. How exactly the work is done? Who makes decisions how the work is done?

    Take coding for example. Who decides whether unit tests are there or not? How many of them? What kind of tests? Who decides on a specific coding style? A manager? Um, no, not really. Most, or even every, of those decisions are made by a coder – a worker.

    Now, the important question: do such decisions define the system which a developer operates in? Obviously! Just think what is going to be the outcome of work of a cowboy coder and what happens when a worker is an eXtreme Programming fan. These are different systems indeed.

    The conclusion of this story is that in our world workers can influence the system heavily, thus completely change the Deming’s equation.

    One might point that leaving people freedom and empowering them is still the part of the system design which is still the management job. I’d disagree. One thing is that adopting a technique or a practice isn’t comparable to moving the machines on a factory floor. I can perfectly start writing unit tests and it doesn’t instantly require everyone else to change the way they work.

    Another thing is that it’s way easier to be a Grace Hopper follower in our industry. We can easily change the part of the system that goes through our desks, no matter whether we are empowered to do so or not. Eventually, if anyone notices (which isn’t that obvious by the way) we should have enough information to have meaningful discussion about the impact of how we’ve done our work.

    All in all, in knowledge work there’s no clear line that separates the system from the people, thus the whole notion of addressing specific part of influence to one or the other is flawed.

    It’s the People, Stupid!

    The last piece of this puzzle is a story. Not that long ago I’ve joined the organization that is exceptional when compared to its surroundings. I’m far from saying that it is a perfect system already, but it’s definitely the most mature company that I’ve ever been working with.

    In fact, it’s not only maturity of software development process we have but also this touchy-feely stuff we call the atmosphere. Not a dream job (yet) but pretty damn close to it when compared to everything else I’ve had a chance to experience.

    Let’s try to translate this to a system definition then. It would be pretty effective. It would be delivering high-quality stuff. It would be a great environment to work at. It would help everyone to grow. How could one possibly not like it?

    The only problem is that I’ve lost one third of technical stuff over the course of few months. The system? No, the people! Their individual needs, frustrations and dreams. Their unique contributions to what the system is, or has been.

    Because at the end of the day, in our world, the system is not machinery with replaceable humanoid parts; it is inseparably connected with the people who operate within the system. Change a single person and the whole system is different. Suddenly the rules of the game have changed and everyone else operates in a very different system. And the only thing that has changed is a single person has left.

    Summary

    My message in all that is that we should first understand our work, how it gets done and what kind of system we operate in. Because when we think about that it becomes obvious that there’s no simple way of separating the people from the system in knowledge work domain, especially when we’re talking about a small scale, e.g. dozens of people, not thousands of them.

    At the same time I’m challenging the common notion of Deming’s rule because it’s nothing close to what Deming really said and it is simply flawed in our domain anyway.

    At the end of the day you should understand the system (obviously!) but focus on the people too if you want a significant change.

  • Better Standups

    I never fancied the standard standup schema. I mean I see value in sharing what the team did yesterday what the team is going to do today and what are the problems the team has.

    Except these questions aren’t answered on a typical standup.

    The first problem is that we answer what specific individuals have done and will do. In any but smallest teams it’s the wrong focus to have. I mean if there are two or three of us it’s very likely that such updates are meaningful. With a couple more people we gradually lose track, and eventually interest, in what exactly is happening in the rest of the team.

    At the same we should be focusing on what is important for the team which may be something no one mentions because for example the biggest pain point is on a plate of someone who is absent or overwhelmed with other stuff that just doesn’t allow them to focus on the real problem.

    The second problem is that very rarely someone really answers to anything by first two questions, namely the issues part is often omitted. I like tweaking the third question, for example to something that Liz Keogh proposes: ”what I would rather be doing.” It helps only a little bit though as it’s almost as easy to avoid this question as the original one.

    The third problem is that with a bigger team a standup becomes just long and boring, and whenever a couple of people exchange a few sentences about any specific bit of work it shuts down almost all the rest of the team instantly.

    A very typical change I introduce is a standup around a board, be it a task board, a Kanban board or what have you.

    Then the discussion is mostly around important stuff that is happening right now and is visualized on the board. A typical pattern is: blockers first, expedite items second, stalled items third and then all the rest. I covered more elaborate version of this approach some time ago.

    Such an approach means that not everyone, every single day speaks up. But whenever anyone has a problem or is just trying to solve an issue too long there’s definitely an update from them on the way.

    Then, there’s always a call for action regarding important stuff, even if it just so happens that a default person for that item is unavailable.

    This means that standups around a board encourage collective ownership of work.

    In fact, there are way more call for action situations as this form of standup basically focuses on solving issues. This often means helping each other, taking over bits of work from others, etc. Whenever someone has hard time coping with all the stuff that waits for them they usually get an instant help.

    This kind of a standup is also shorter than a classic one. After all you don’t mention all the boring stuff that just goes as planned – everyone can see that on the board, so what’s the point anyway?

    It also is an occasion to catch all the inconsistencies on the board so it serves another purpose too. You don’t get that from a classic standup.

    I would also point that this approach does very good job in terms of keeping work in progress low. It simply changes the dynamics of the discussion toward everything that is in progress from a team perspective instead of work started by individuals. The latter doesn’t take into account all the waiting queues.

    Finally, it scales up pretty well. You can run such a standup with a dozen or more people and it still fits nicely 15 minute slot. It’s not rare when you need only one third of that even with such a big team.

    The impact of changing the standup pattern is almost instant. All in all, it makes standups more valuable for the team. Try this approach, especially when you struggle with the current one right now.