≡ Menu
Pawel Brodzinski on Software Project Management

Cumulative Flow Diagram

Cumulative Flow Diagram post image

One of charts that give you a quick overview of what’s happening in a project or product work is Cumulative Flow Diagram (CFD). On one hand in CFD you can find typical information about status of work: how much work is done, ongoing and in backlog, what is the pace of progress, etc. This is the basic stuff. On the other hand, once you understand the chart, it will help you to spot all sorts of issues that a team may be facing. This is where Cumulative Flow Diagram shows its real value.

Before we move to all the specific cases let me start with the basic stuff though (feel free to scroll down if you’re familiar with this part).

Cumulative Flow Diagram

The mechanism of Cumulative Flow Diagram is very simple. On a vertical axis we have a number of tasks. On a horizontal one we have a timeline. The curves are basically a number of items in any possible state shown in a time perspective. The whole trick is that they are shown cumulatively.

If the green curve shows stuff that is done it will naturally grow over time – that’s simple. If the blue line shows tasks that are in progress, and we have stable amount of work in progress it will still go up as it adds to the green line. In other words work in progress would be represented by the gap between the blue and the green lines… We’ll come back to that in a while.

Any line on CFD represents a specific stage. In the simplest example we’d have items that are to be done, stuff that is ongoing and things that are done.

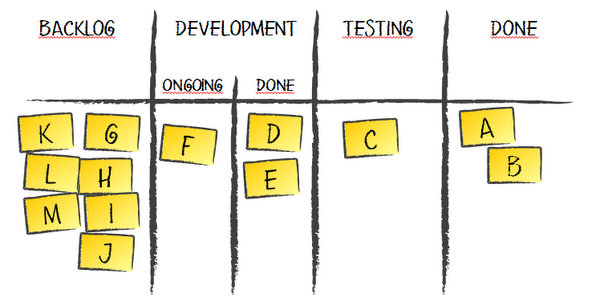
For the sake of the rest of this article I’m going to use a simple process as a reference.

Workflow

We have a backlog, items that are in development or testing and stuff that is done. For the sake of Cumulative Flow Diagram examples it doesn’t matter whether tasks in development are ongoing or done and waiting for testing. However, as we will find later, there may be some indicators that would make tracking these two stages separately valuable.

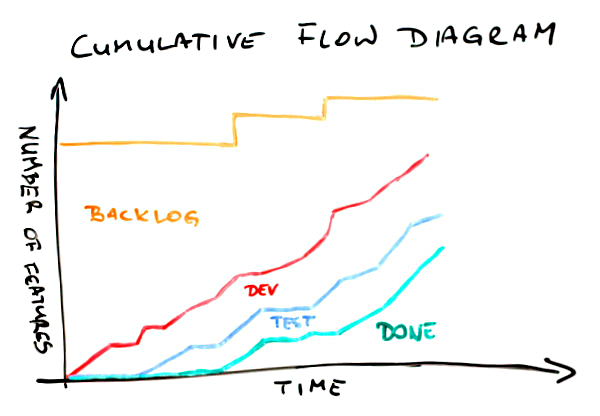
With such a workflow our Cumulative Flow Diagram may look like this.

Cumulative Flow Diagram

First, the meaning of the lines. The green one shows how many items have been delivered over time. Everything that is between the blue and the green curves is stuff that is in testing. The area between the red and the blue lines shows how much stuff is in development (either ongoing or done). Finally, the top part below the orange line is the backlog – how many items weren’t yet started.

In a glimpse we can find a few important bits of information about this project. First, after slow start a pace of delivery is rather stable. Pretty much the same can be said about work that is in progress – the pace is stable and things go rather smoothly. We know that the scope has increased a couple of times, which we can tell looking at jumps of the orange line. Finally, comparing where the green line (done) and the orange line (scope) are on a vertical axis right now we can say that we’re not yet halfway through the project.

Quite a lot of information for the few seconds, isn’t it? Well, there is more.

Cumulative Flow Diagram

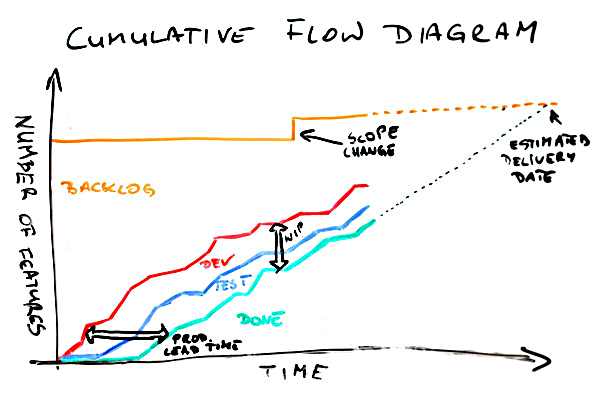
On this CFD a few things have been shown explicitly. One is a scope change. We’ve discussed it on the previous chart too. Another one is the space between the red and the green lines. It represents work in progress (WIP). Note, basing on Cumulative Flow Diagram only you can’t learn how much work in progress you have precisely; it is some sort of approximation. Pretty good one, but only approximation. It is a very good indicator how WIP is changing over time though. There also is an arrow labeled “prod. lead time” where “prod.” stands for production. It roughly shows how much time we need to complete an item. Again, it shouldn’t be used as the ultimate lead time indicator but it shows pretty well what lead time we’ve had and how it changes over time. Finally, we can approximate slope of done curve to roughly estimate the delivery time. Of course if the scope changes the delivery time will change as well thus the scope line (the orange one) is also approximated.

Now, we have even more information. Yay!

You will rarely see such nice Cumulative Flow Diagrams though. And that’s good news actually. I mean if CFD looks plain and nice all the time you can only learn that much from it. The real CFD magic is revealed when things don’t go so well.

Let’s go through several typical cases.

Cumulative Flow Diagram

In this situation the spread between the red and the green lines is growing over time. It indicates a really bad thing – we have more and more work in progress. That sucks. Increased WIP means increased lead time as well. Not only is time to market longer but also it is more and more difficult to deliver anything fast when we need it.

That’s not the worst thing. The worst thing is that with increased amount of work in progress we also increase multitasking thus we incur all the costs of context switching making the team less efficient.

Do we know that for sure? Um… no, not really. I make here an assumption that the team setup hasn’t changed, meaning that we have the same people spending similar amount of time on a project, etc. If it was Cumulative Flow Diagram for a team that is constantly growing and then it would be just OK. The chart may also present an increasing number of blocked tickets which definitely would be a problem but a different one then described above.

In either case such a situation is a call for more analysis before jumping to conclusions. The potential reasons I offer you with this and following charts are simply the likely ones; not the only available.

By the way, please treat all the following remarks keeping that in mind.

One more interesting observation about this Cumulative Flow Diagram is that we have no clues where the root cause for increasing WIP lays. Neither development nor testing part seems to be steadily attached to any other line over time. A further investigation is a must.

There are charts where we get some clues which stage of a process is problematic.

Cumulative Flow Diagram

Whoa, this time the development part compared to the testing part is really heavy. What can we learn from it? We don’t have problems with testing. Also, if a definition of testing is “testing and bug fixing,” which is a typical approach, it doesn’t seem that quality of work is much of an issue either. If we are to point fingers we’d point them to development part, wouldn’t we?

And we might have been wrong. Of course one thing that may be happening here is a lot of items in development but few of them ready to test. Another issue though may be that there is a lot of stuff waiting for testing but availability of testers is very limited and when they’re available they focus on finishing what they started.

How can we tell? We can’t unless we have more data. In fact, another line on the chart – one that distinguishes items in “development ongoing” from those in “development done” – would help. Without that the CFD is only an indicator of a problem and a call for a deeper analysis. After all, that’s what Cumulative Flow Diagrams are for.

Another flavor of a similar issue is on the next CFD.

Cumulative Flow Diagram

We can find two things here. Let’s start with the more obvious one – the shape of the green line. It looks like stairs, doesn’t it? Stairs are typical when the last stage, which commonly is some sort of deployment, is done in cadences, e.g. weekly, biweekly, etc. Building on that, a stairs-shaped delivery line mean that work in progress and lead time would vary depending on a moment of release cadence you’re in. Maybe it’s time to make a step toward continuous

There is one more thing here though. There is pretty significant, and increasing, number of items that are in testing but don’t get released. The gap between the blue and the green line is growing with each consecutive release.

This one is a real issue here. It may mean that we have a problem with quality and we can hardly reach a state when an item has all the bugs fixed. It may mean that developers simply don’t pay much attention to fixing bugs but tend to start new stuff; at the same testers would follow up on new stories as they wait for bug fixes for the old ones anyway. It may mean that a code base is organized in a way that doesn’t allow releasing everything that is ready. Once again, the root cause is yet to be nailed but at least we know where to start.

It seems we have more questions than answers. If you think that I’m not helping it will be no different with the next example.

Cumulative Flow Diagram

This would happen occasionally in almost every team. All the lines flatten out. What the heck? The first thing I do when I see that is I check for public holidays or company-wide event happening during that time. It may simply be time when no one was actually working on a project and there is a perfect explanation for that.

Sometimes it is not the case though. This is when things get interesting. If everyone was at work but the chart still indicates that no one got anything done it most likely tells a story about serious problems. A staging environment could have gone down so everyone has been focusing on bringing it back alive. Another project could have needed help and virtually everyone has been sucked there. There could have been a painful blocker that has forced everyone in the team to refocus for a while.

In either case, whatever it was it seems to be solved already as the team is back on track with their pace.

Another flavor of such a scenario would look a bit differently. It would give more hints too.

Cumulative Flow Diagram

There are two important differences between this and the previous Cumulative Flow Diagrams. One is that, in this case, only two lines flatten out; the development line keeps the healthy progress. The other is that ends of both the green and the blue line are as flat as a table top.

The latter suggests that whatever is the problem it isn’t solved yet. What the problem might be though? It seems that the team has no problem starting development of new items. They can’t, however, start testing, thus they clearly can’t deliver anything either. One of probable hypothesis would be that there is something seriously wrong with either the testing environment or the testers.

In the first case it just isn’t technically possible to verify that anything works as intended. In the second it seems something bad happen to our only tester (if there were more than one there would likely be some progress). There is another hint too. Developers don’t seem to care. They just start, and possibly complete, their stuff as if nothing happened.

I’d say that these guys have to deal first with the issue and then discuss how they collaborate. I sense a deeper problem here.

The same way as the previous example indicates an issue in the way people cooperate, the next one suggest a quality problem.

Cumulative Flow Diagram

Development line goes up in a stable and predictable manner. The testing curve? Not so much. And we better not mention the done line. Obviously we have more and more work in progress here over time – we’ve covered this one before.

But wait, then suddenly the magic happens and everything goes back on track. At the very end we have decently small amount of work in progress and much stuff delivered. The smell here is how the done (and testing to some point as well) curve skyrockets at the end.

How come that earlier such pace was impossible? I’d challenge the idea that the team suddenly become so fast. Of course they might have not kept the board up-to-date and then, out of the blue, have realized that they’ve had way more finished items that they’ve thought they had.

More likely scenario is that under pressure they just deployed whatever seemed at least remotely close to working. If that’s true the problem isn’t solved at all and it’s going to come back to bite them in their butt. A curious reader may try to draw a picture how further part of Cumulative Flow Diagram would look like in this case.

The next one is one of my favorites. I wonder why it is so far down the list. Oh well…

Cumulative Flow Diagram

This Cumulative Flow Diagram is surprisingly common. Let’s try to list a few things that we can find here. The development curve goes up aggressively. Halfway through more than 80% of items are started. Testing doesn’t go nearly that well. And delivery? Well, the start was crappy, I admit, but then it simply went through the roof. And it isn’t only a single day that would suggest delivery of uncompleted stuff. Odds are that these items are properly done. Wouldn’t bet the real money on that but wouldn’t be surprised if that it was so either.

Of course we have very high WIP in the middle of this CFD but at both ends the gap seems to be significantly smaller.

Ah, one more thing. It seems that at the end of the day we’ve delivered everything that was in the backlog. Yay!

Now, what would be the diagnosis in this case? Time boxing! This is one of classic visualizations of what typically happens over the course of an iteration. If a team is comfortable with planning and has rather stable velocity it’s likely that they’d fill backlog with reasonable amount of new features.

Then, given no WIP limits within the time box everyone does their own thing: developers quickly start many features having no pressure other than the end of the iteration to finish stuff. Eventually, the backlog is cleared so the team refocuses to finish stuff, thus the acceleration at the latter stages of the process.

If you pictured a series of such Cumulative Flow Diagrams attached one to another you’d see a nice chain going North-East. You’d find many of these in Scrum teams.

Another chart, despite some similarities to the previous two, suggests a different issue.

Cumulative Flow Diagram

In this case almost everything looks fine. Almost, as the done line barely moves above the horizontal axis. However, when it finally moves it goes really high though. What does it mean?

My guess would be that the team might have been ready with the stuff but, for whatever reasons, they wouldn’t deliver. In fact this is one of typical patterns in fixed price, fixed date projects, especially in bigger ones. Sometimes a basic measure that is tracked is how many items are done by the production team. No one pays attention whether it can possibly be deployed in production or even staging environment.

Eventually, it all gets deployed. Somehow. The deployment part is long, painful and frustrating though. Cumulative Flow Diagram representation of that pain and tears would be that huge narrow step of the done curve.

Talking about huge and narrow steps…

Cumulative Flow Diagram

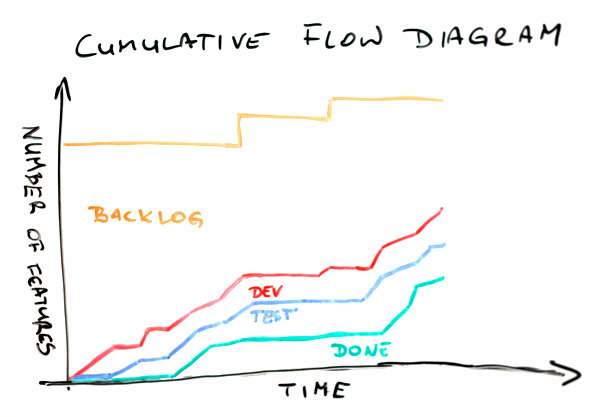
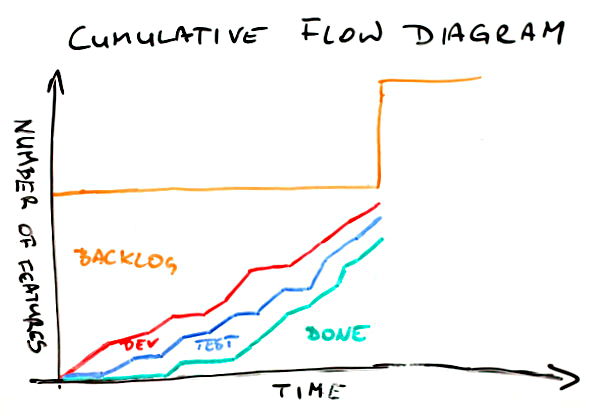
Another chart has such a step too. We’ve already covered its meaning at the very beginning – it is the change of the scope. In this case it is not about the fact that such change has happened but about its scale and timing.

First, the change is huge. It seems to be more than a half of initial scope added on the top of it. Second, it happens out of the sudden and pretty late in the project. We might have been planning the end date and now, surprise, surprise, we barely are halfway through again.

Now, this doesn’t have to be a dysfunction. If you were talking with the client about the change or it is simply a representation of expected backlog replenishment that’s perfectly fine. In either case you it shouldn’t come as a surprise.

If it does, well, that’s a different story. First, if you happen to work on fixed prices contract… man, you’re screwed up big time. It isn’t even scope creep. Your scope has just got on steroids and beaten world record in sprint. That hurts. Second, no matter the case you likely planned something for these people. The problem is it’s not going to happen as they have hell lot of work to do in the old project, sorry.

So far lines on Cumulative Flow Diagrams were going only up or, at worst, were flat. After all, you’d expect that given the mechanism of creating the chart. That’s the theory. In reality a following chart shouldn’t be that much of a surprise for you.

Cumulative Flow Diagram

Whoa! What happened here? A number of stories in testing went down. The red line representing stuff in development followed but don’t be fooled. Since the gap between the red and the blue line is stable nothing really happened to the items in development; it’s only stuff in testing that was affected.

Now, where did it go? Definitely not to done bucket – the green line didn’t move. It didn’t disappear either as the total number of items (the orange line) seems to be stable. A few items had to go from testing to backlog then.

What could it mean? Without an investigation it’s hard to say. I have good news though. The investigation shouldn’t be long – such things don’t happen every other day. For whatever reasons stuff that was supposed to go past code complete milestone was marked as not started.

I sense a major architectural or functional change. What’s more, it’s quite probable that the change was triggered by the tests of aforementioned items. Unfortunately it also means that we’ve wasted quite some time building wrong stuff.

Another flavor of that problem looks a bit scarier.

Cumulative Flow Diagram

Again, the total scope didn’t change. On the other end every other line took a nosedive. Once again amount of stuff in development doesn’t seem to be affected. This time the same can be said about items in testing. It’s the delivered stuff that got back to the square one.

It means that something that we though was done wasn’t so. One thing is that we were building wrong stuff, exactly as in the previous example, only we discovered it later. We likely pay the order of magnitude bigger price for the late discovery.

There’s more in it though. This Cumulative Flow Diagram shows that we likely have problems with acceptance criteria and / or collaboration with a client. I mean how come that something that was good is not so anymore? Either someone accepted that without checking or we simply don’t talk to each other. No matter the case it sucks big time.

Would the orange line never move down then? Oh yes, it would.

Cumulative Flow Diagram

I mean, besides an obvious case where a few items are removed from backlog and the only line that moves down would be the orange one, we may find this case. Using the technique perfected in the previous examples we will quickly find that a few items that were in testing are… um, where they are actually?

Nowhere. They’ve disappeared. They haven’t been completed, they haven’t been moved back. These items are no more.

What does it mean? First, one more time we’ve been working on wrong stuff (fools we are). Second, we’ve figured it out pretty late (but could have been later). Third, the stuff doesn’t seem to be useful at all anymore.

It’s likely that we realized that we don’t know how exactly build this or that and we asked the client just to learn that they don’t need either of those anymore. It’s also likely that we’ve encountered a major technical issue and rethought how we tackle the scope possibly simplifying the whole approach. Whatever it was, if we had figured it out earlier it wouldn’t have been so costly.

Finally, one more Cumulative Flow Diagram I want to share with you.

Cumulative Flow Diagram

Think for a while what’s wrong with this one.

When compared to the previous charts it seems pretty fine. However, by now you should be able to say something about this one too.

OK, I won’t keep you in suspense. In the first part of this CFD work in progress was slowly but stably growing. However, it seems that someone noticed that and the team stopped starting new stuff. You can tell that seeing how relatively flat the red line has become somewhere in the middle of the chart.

Given some time testing and delivery, even though their pace hasn’t changed, caught up. Work in progress is kept at bay again and the team’s efficiency is likely improved.

As you can see, despite past several examples, you can see the effects on improvements at Cumulative Flow Diagrams too. It’s just that CFD is more interesting in terms of learning that you have a problem than finding confirmation that you’ve solved it. The latter will likely be pretty obvious anyway.

Congratulations! You made it through to what is probably the longest article in the history of this blog. Hopefully you now understand how to read Cumulative Flow Diagrams and what it may indicate.

I have bad news for you though. You will rarely, if ever, see such nice CFDs as shown in the examples. Most likely you will see an overlapping combination of at least a few patterns. This will likely make all the lines look like they were tracing a rollercoaster wagon.

Fear not. Once you get what may be happening under the hood of the chart you will quickly come up with the good ideas and the right places to start you investigation. After all, Cumulative Flow Diagram will only suggest you a problem. Tracking it down and finding an antidote is a completely different story.

However, if you’re looking for a nice health-o-meter for your team Cumulative Flow Diagram is a natural choice.

in: kanban, project management

55 comments… add one

  • Don Ewart July 16, 2013, 1:36 am

    A lovely description and explanation of CFD – I hope this hightlights to new teams the ease and importance of tracking work. I will definitely use this as a great reference.

  • Henrik Larsson July 17, 2013, 11:21 pm

    Excellent post om CFDs. I don’t understand why burndown charts are still promoted by agile experts. In my team, we have abandoned sprint burn down chart and are using sprint CFD instead. It provides much more information.

    Thanks!!!

  • Josh July 18, 2013, 10:05 am

    Beautiful Stuff, especially as I’m part of assisting an organisational transition to Kanban and CFDs

  • Srinath July 19, 2013, 8:54 am

    Great post .. wonderful insights into CFDs and great explanation of the reasons behind the various “flows”.

  • Jeff August 7, 2013, 5:01 am

    Very nice post…. I would still put more emphasis on the wait times… the time between activities. At the end of the day, a bias toward flow means your easiest opportunity to get more out is to minimize delays. In product development as in manufacturing… waiting is your biggest waste and your best lever in seeing the problems and balancing the system. Separating delay from actual work, you also get a better feel for how long the work really takes versus mismatches in resources or other areas to focus in on. Maybe there is a need to focus on tools or training or aspects of quality in the specific activities; are problems being passed downstream, for example? You do have to be careful of knee-jerk reactions also… knowledge work is not normalized – surprises and learnings occur, new approaches have to be tried, sometimes test takes longer and other times coding… but patterns mean a lot. With wait times, you more easily see the bottlenecks (where is the work piling up) and have early opportunities to drive resources to the need. Keeping the flow steady helps throughout the system – making it less likely that any part of the value stream becomes starved and helping you tune the system for better and better results.

  • Pawel Brodzinski August 12, 2013, 11:32 am

    @Jeff – While I’m totally with you when it comes to wait time elimination I don’t think that Cumulative Flow Diagram is excessively useful to track down wait times. One thing that comes handy is having a separate hand-off columns tracked as a separate line, e.g. testing in progress would be a different column than testing done / waiting for deployment.

    Having said that, wait time is often hidden in “active” stages, e.g. a tester is waiting for answers for their questions and pulls another item to work on.

    When you use physical boards it also is a pain in the neck to track down dates for every single status update for a task.

    For tracking down waiting time I use another trick which is writing down touch time on stickies (daily). Once an item is done I can compare total touch time with the maximum time elapsed between start and end dates of the item. It isn’t precise as technically more than a single person can work on a task (pairing, simultaneous testing and bug fixing, etc.) but even then hitting anything close to 100% simply doesn’t happen.

    I guess it is worth another post….

  • Anthony September 12, 2013, 4:10 am

    Hi, this is a great post. I was wondering if you have any suggestions with regards to a) loops in the process or b) branching processes or c) continuously removing things from done to reduce the overall number of cards.

    a) Loops in the process: So we have a process that’s basically linear, but with multiple reviews, where each reviewer (e.g. the tester) could be sending cards back to development. Would you say that such loop in the process would render the CFD less meaningful?

    b) We also have 2 slightly different processes, A and B, done by the team, on the same board. They are essentially the same, but there are 3 steps which A is going through and B is not, while B goes through 1 step that A doesn’t go through. They all end up at the same place. Do you think this would render the aggregate CFD meaningless? Should it be OK to have those 2 processes in parallel?

    c) Since the CFD is cumulative, at some point, the ‘done’ section is rather large. We’re using trello, so there is a growing number of ‘done’ cards, which slows the board down. Do you know of any good practices to continuously remove done cards (e.g. ‘remove all done cards once per month/quarter’ or ‘remove all cards from one project or workstream once that project is completed’?) there are multiple projects / workstreams / teams on the same board, the board is kind of the entire teams’ board.

    Thanks a lot for your help!

  • Pawel Brodzinski September 15, 2013, 12:16 pm

    @Anthony – One thing I usually discourage teams to use is loops. On one hand they typically happen – pretty much any example of rework would be some kind of a loop. On the other it all boils down to how you define the stages of your process. In majority of cases a column labeled “testing” would mean for me “testing, bug fixing and retesting,” a column “code review” would mean “code review, implementing changes from code review and another review if needed” etc.

    The thing you get this way is good understanding which work item is closer to done. If a feature A went through development and testing and it requires some rework to make it working correctly it is in a very different status than a feature B, which was just started and development isn’t even completed.

    I also advise teams to read the board from the right to the left (actually from Done to Backlog as the direction can vary) because then they first discuss stuff that is closest to done, which is exactly what should be happening. Unless there’s an important reason, e.g. expedite, the higher priority should be assigned to work items that can be finished faster. Thanks to this, we remove work in progress from the system, make context switching problem less painful and likely improve team-level productivity.

    A side effect of such approach to the board is rendering once concern regarding CFD irrelevant.

    For different processes I’d start with a couple questions:
    – Will you be analyzing both types of work at the same time or separately?
    – What is the importance of tracking in details 3 steps that are relevant to process A and irrelevant to process B?

    Depending on a situation you may want to primarily use separate CFDs filtered for a single type of work. Of course you’d likely take a look at aggregate CFD as well, but it may be way less important. Of course the opposite may also be true.

    If you work with aggregated CFD most of the time, these additional steps that happen only for one type of work can be of little importance so you potentially can ignore them in CFD altogether.

    An alternative may be going with visualization of the stuff exactly the way it is. You’d just need to remember that three specific steps are relevant for only one class of work items, thus lower volume of work there is expected.

    Finally, you can ignore these steps in CFD but track them using different method. Then if you look at CFD and potentially see a problem in a stage that is aggregated from a few stages you can refer to the data elsewhere to learn more details.

    You also ask about removing cards from the board. I tend to do it regularly, like weekly or something like this. Sometimes we use removing cards from the board as an additional step of the process although irrelevant for the building part, e.g. we remove work items from the board once a client is billed for that work.

    Either way my preference goes to do it rather more than less frequently. At the same time it doesn’t have to be directly related to CFD. I mean once something is done it is done forever. Now depending on how far into the past you want to go with CFD you will want or will not want to see a specific feature that was done a month ago.

    As a rule of thumb I’d say that CFD on a day 0 shouldn’t have anything done. Now the questions is: what exactly is a day 0? For a project that lasts 20 months it doesn’t make any sense to run CFD daily from the very first day of a project. You’d typically want to see the last month, maybe a couple of them, so in the context of a specific instance of CFD day 0 would mean for example two months ago. In this case you will be tracking only the number of work items that have gotten done since then.

    This is, by the way, a reason why most of CFDs in electronic tools are flawed since they basically assume direct relationship between the stuff that in done column and the CFD. This relationship though is contextual and usually depends on the time period covered by a specific instance of CFD you generate.

  • Fahim November 17, 2013, 4:33 pm

    Great post. Behind the scenes question: it seems you drew the charts on the whiteboard and “cleaned” them up using a photo editor, right? What’s the best process to “clean” in your experience? BTW, cfd-15.jpg may have been missed :)

  • Pawel Brodzinski November 19, 2013, 9:54 am

    @Fahim, I typically increase contrast and brightness and it’s enough. Sometimes it requires a bit more manual work, e.g. different adjustments in different parts of the pic, but these two do the trick.

  • @sleepyfox January 24, 2014, 4:42 am

    Great article, one minor correction: in your second CFD “estimated delivery date” is a horizontal continuation of the size of the total number of task items (which you refer to as backlog), yet the items done is extended as a trend line. Unless you’re absolutely certain there will be no more scope change, then the total should be a trend line too, and the estimated delivery date should be where these two trend lines intersect.

    I personally don’t refer to the orange line as ‘backlog’, because although it starts out as being the size of the backlog before any items enter production, it actually refers to the total amount of work in scope in the project, the backlog is actually the vertical difference between the orange line and the red line.

    Congratulations on a good contribution to Kanban and CFDs!

  • Pawel Brodzinski January 24, 2014, 5:21 am

    @sleepyfox – It’s a a very good and valid point. There’s more depth into that though.

    There are two pretty typical patterns I find in projects. One is that the scope is stable most of the time and there are very few significant changes in the backlog. In such cases I prefer not to use a trend line for the total work line. There’s too few data points to make the trend line reasonable.

    The other reason why I tend not to use trend line for the project scope is that I consider backlog to be available for changes. In other words if we don’t like the date shown by done trend line and the scope line we can either throw something out from the backlog (and bring the finish date closer) or at least start a discussion with a client about that.

    Such situations are basically a conscious a trend change. Even if so far a trend was that we have more and more stuff in the scope we consciously decide to axe the current backlog thus making the trend line irrelevant.

    The other pattern is that backlog is changing very frequently as product owners work with it very actively. In such a case the scope line would look more all the other lines in CFD–it would be steadily raising over time. In this scenario I would definitely go with a trend line for the backlog.

    For the naming, the precise meaning of the labels in the CFDs is an area, not a line. In other words, backlog refers to the height of the area between red and orange lines and it is the actual size of the backlog. I do sometimes use the same name for the upper line of the area too, which might have added a bit of confusion.

    Basically we are talking about the same thing though.

  • Robert January 24, 2014, 10:07 am

    Do not know what you wish to explain but this is can be far more elegantly explained using proper math. Anyone with a math background will Fins this hard to understand.

  • Ian Wells February 12, 2014, 3:40 pm

    Excellent article and explanation. This is of course predicated on having a reliable way of capturing the work being done and this requires design/buy in by the team to use it accurately. I have found written explanations ( that you provide in your example) are key because these charts can be misunderstood without the cause of the trends being explained. Good job.

  • Chuck Durfee May 20, 2014, 9:02 am

    This article is excellent! I learned a lot about reading CFD patterns.

  • Leena November 26, 2014, 5:52 am

    Thanks a lot for the post, excellent one, very useful.

    I am trying to create CFDs with the data available to me right now. Please find a sample spreadsheet in the following URL:

    https://docs.google.com/spreadsheet/pub?key=0ApUPwJdQvqT_dHJvMHR2NklLS05GX1pBcDM3bjI2T3c&gid=4

    I am not able to arrive at “prod. lead time” from the above. Will you be able to help me understand the problem? You can also see the values in the same spreadsheet.

    The similar pattern can be found in the following image too.

    https://trello-attachments.s3.amazonaws.com/546f3ad4bc4592cb310726de/800×333/0f28de575112d78018d95e6862b2a614/Closer-CFD.png

    Is it that the lead time is so unpredictable because too much of WIP?

    Looking forward to hear from you. Thanks once again.

  • Pawel Brodzinski November 26, 2014, 9:09 am

    @Leena – One of the final thoughts of the article was “I have bad news for you though. You will rarely, if ever, see such nice CFDs as shown in the examples.” Your case is a nice example of that.

    The data you have in the spreadsheet is not enough to precisely assess lead times. The way you typically do it is you gather a start date (when a work item moved from backlog to analysis in your example) and an end date (when a work item moved from acceptance to done in your example) for each work item you work on. Then production lead time (or cycle time) is simply the difference between the two dates.

    If the only bit of data you have is count of work items in the specific stages of the process you can’t derive the lead times easily from that.

    What you can do is to roughly assess what are typical lead times in your process. Since the horizontal axis represents basically a timeline you may draw a horizontal line from the green line (in your case it represents the change of status from in backlog to analysis) to a blue line (in your case it represents change of status from approval to done). The length of the line mapped to x axis would simply tell you approximate production lead time.

    The tricky part is that you don’t yet have enough data (not enough delivered stuff) to be able to do that.

    There are also situations that beg for answers. What did happen on Nov 12th and Nov 18th? In both cases it seems that stuff that was supposed to be done disappeared. All the other lines on the CFD followed but basically this was the basic cause in both cases.

    The other example that you share suggests something different. It seems it’s just automatically generated CFD that didn’t take into account the fact that someone archived lots of stuff that was in acceptance (both working on and waiting sub-statuses).

    Another thing is that the chart suggests that the last status of the process is acceptance: working on, which seems strange. Unless labels are messed up and the blue area is really what’s done.

    In the latter case there’s another question to ask: the last line is flat. Why was nothing delivered over the period of time even though all the other lines seem to go up in a healthy manner?

    If the labels are OK I’d ask what’s happening with acceptance? It seems as nothing gets accepted and the queue of work waiting for acceptance is out of control.

    And then we have a period starting on Nov 21st where all the work seems to be stalled.

    I hope that helps.

  • Leena November 26, 2014, 9:52 am

    Thanks for your reply. Yes, as the CFD shows, we’ve issues with Acceptance, i.e. items are piled up for Acceptance from the customer.

    Thanks for throwing more light on items not getting moved to “Done”. I didn’t notice that much.

  • Eldad February 7, 2015, 3:25 pm

    Excellent post, in particular the examples which you dont usually find on other pages that explain CFDs. In our company we use an electronic tool to track user stories for ~20 teams working on a large product, using Scrum as the way of working, with sprints and releases and with Product Owners very involved and active with the backlog.
    1. Could you give an example to explain your comment about electronic tools being problematic for CFDs? I did not understand the implications and an example here would be very useful.
    2. Since we are using an electronic tool, is there something we can do to workaround this flawed assumption in the tool that you mentioned – is there something we should change about the way we read it?
    3. We dont have a Testing column – we have an In Progress (development and testing), Completed (developer confirms that it met Acceptance Criteria) and Accepted (by the Product Owner – usually during the sprint but at worst in the Sprint Review). Our Completed area of the graph is usually very thin and almost not noticeable, while the Accepted area is growing steadily. What would be your questions to start investigating from that?

  • Pawel Brodzinski February 8, 2015, 2:28 pm

    @Eldad – I’m glad that you liked the post. To answer your questions:

    1. Gathering the complete data for CFD manually, e.g. from a whiteboard is a major pain in the neck. This is a huge advantage of any electronic tool that give you all the basic data for free. The problem is a tool is dumb. What happens when you accidentally move a work item (feature, story, etc) to in progress column and then you realize it was a mistake and pull it back to sprint backlog? The tool already tracked the event. Then a couple of days later you’ll pull this item to in progress but this time for real. The tool has now two events of starting the task.

    This issue is deeper and is adds noise in cases when tickets are moved back and forth. With a physical whiteboard, since the data is gathered manually, every time a human has a chance to make a decision whether a specific date of a specific event should be corrected or kept unchanged. That’s why quality of such data is typically much better.

    As mentioned before it add a lot of hassle for a team so it is always worth considering how much data you need. I typically propose 2 or 3 dates: (optionally) date of adding to backlog, date started (first time a team touches a task), date finished (done). This doesn’t give you much details about what’s happening inside of the process yet it still provides general overview and if you need to learn more you may, for some time, gather more detailed data.

    2. If you’re using an electronic tool it is always helpful to keep some discipline in how people use the tool:
    – Have items properly labeled, e.g. stories, bugs, chores, etc. so that you can interpret them later in a reasonable manner
    – Make sure all the work is tracked with the tool, especially when something unplanned pops up or a task happens to be a series of tasks really.
    – Keep an electronic board up to date with statuses, as it will simply track down what’s in its database and will not retroactively figure out what happened and make informed decisions what dates should be used.

    3. I would start with a question what “Accepted” may mean. If a story is in accepted column does it mean that a PO is in a process of reviewing and accepting the story or it has already been accepted? If the latter is true, what happens next after acceptance?

    There are two basic reasons why work queues up in a specific station: it is either actively worked on there or it’s done in that station but is not pulled to another station in the process.

    In your case it would either mean that acceptance takes a long time or whatever is happening after acceptance is a bottleneck. The latter case would mean that stories are actually accepted but the next thing (deployment or whatever that is) is not happening.

    That’s by the way why it makes sense to distinguish “stage of a process in progress” from “stage of a process done” statuses (typically with subcolums on a board). If the stories queue up in “acceptance in progress” this suggests that POs are slow to accept them. If they queue up in “acceptance done” it is the later stage of the process that blocks the flow.

  • Eldad February 8, 2015, 2:47 pm

    Thanks – seems like using the tool is the way to go for us – as you say its a lot of hassle for the team and we have many teams. From what I can see after your comments is that our issue is we may need to more accurately reflect the stages, i.e., add more stages for in progress and done. That is a lot easier to change on a board than in a heavy tool once you have configured it and added lots of info.

  • Paul Boos March 12, 2015, 10:36 am

    Pawel, thanks again for this excellent post; I just wanted to share that I seem to be pointing people to it in increasing numbers.

    Cheers my friend!
    Paul

  • Pawel Brodzinski March 12, 2015, 1:27 pm

    Thanks Paul! I’m glad that you find it useful and valuable.

  • Adam April 17, 2015, 11:40 am

    Hi Pawel! Thank you for great explanation on CFD!

    One thing bothers me. Tasks in backlog (userstories, bugs etc) have different lead times. So, for example, if we have 3 short tasks and 1 very demanding the CFD will fail. When 3 short tasks are done the chart shows us that we have 75% job done but it wouldn’t be true. One remaining long task can take the same time as 3 previous ones.

    How do you deal with this? Do you create tasks keeping in mind to make their lenght similar or use another method?

  • Pawel Brodzinski April 18, 2015, 11:30 am

    @Adam – One thing is that you may want to show some sort of a relative measure of sizing on a vertical scale, e.g. adjust how many story points you burn up with each feature or adjust that for T-shirt sizing etc.

    A thing is, that what research shows the best measure of throughput in the long run is simply counting stories. With enough data samples sizing doesn’t matter that much, if at all.

    Another thing is that what you refer to is effort needed to build a task. I would point though that the dynamics of CFD focuses more on lead times, i.e. how much time elapsed since we started working on a task till it’s been completed.

    The reports we get in the industry show that correlation between these two is very weak. Oftentimes we’d find flow efficiency (active work time on a task / task lead time) below 10%, sometimes much below 10%. In other words focus on removing wait times for a task will have much bigger impact that e.g. cutting the actual effort in half.

    This is another reason why concerns about task sizing isn’t that important in this context.

  • Marcel Kohls May 27, 2015, 7:45 am

    Congratulations, Pawel! The article is full of clear explanations about many situations. Very useful for a CFD dummy like me. :)

  • Dave Browett July 9, 2015, 5:04 am

    Pawel – great article, I hope you don’t mind if I refer to it in my blog

  • Pawel Brodzinski July 12, 2015, 1:25 pm

    @Dave – Please do. No worries.

  • Rudra Mohanty June 1, 2017, 1:13 am

    Lovely description and explanation..
    Thanks.

  • David Rouse June 6, 2017, 9:35 am

    Great write up on CFD. How would you suggest using a CFD diagram in the following scenario. We are a product team working on continuous evolution of a product. We don’t do projects. On any given day we could be in planning on feature set A, in dev on feature sets B,C,D releasing feature set E. This is possible because not everyone participates in everything ie: We don’t have a crazy multitasking environment. We also welcome frequent additions to our backlog of suggestions and ideas some of which we will never do. The problem I have here is that an overall CFD provides a very distorted picture. The backlog is disproportionately huge and it becomes very difficult to zoom in on a problem area given that we have multiple efforts in multiple stages at any given time. I know this model of work is not unique to us so I am wondering what are the best adaptations for a CFD in this case? We are working with JIRA so the pain of setting up and maintaining multiple CFDs per initiative could be measures on a scale labeled “Number of kicks in the genitals with a work boot”. Any suggestions? I feel like we should be able to squeeze some value out of CFD but so far it’s not helping the team much.

  • Jenny L July 5, 2017, 8:01 pm

    Hi Pawel,

    Thank you for writing such a great article.

    I have this same question with Anthony. If the current process uses a testing-developing loop with Kanban and the loop cannot be changed to linear, can we still use CFD to find bottlenecks?

    Your answer to this question is a yes or no? If yes, does the case analysis in your article still work? Or how do we do the analysis differently if there is a testing-developing loop?

    Thanks,
    Jenny

  • Pawel Brodzinski July 6, 2017, 7:06 am

    @Jenny – Since CFD design is very basic you can, of course, apply in a workflow with development & testing loop. The thing you will likely be seeing would be a jumpy curve separating development and testing stages. At the same time lines separating development from earlier stages and testing from later stages will likely be doing just fine.

    Information that will be lost in such implementation would be differentiation between new features in development versus old features in bug fixing. They would all be in the same bucket (area of CFD).

    What does it mean? It means that, depending on the exact design of the loop, some bottlenecks will be visible and some won’t.

    Details depend on the exact design on a workflow you work with. Let’s assume that a developer has finished working on a feature. Then it’s pulled by a tester and there are bug found. Does it wait in testing with a label “to be fixed” till a developer pulls it back? Or is it pushed back to “in development” phase by a tester?

    A side note: pull approach allows to control work in progress while push does not.

    Depending on where the ticket lands it would be counted in a different “bucket” of CFD.

    Let’s assume that it’s a developer that pulls the ticket back. Then we can have a situation where we have a long queue of tickets in testing and we see it in CFD. Where is the bottleneck? Well, it can be in two places: either there’s a lot of features that wait for bug fixing, or a lot of tickets waiting for the next stages, say, to be deployed, or a lot tickets under testing.

    A simple look at CFD won’t tell you which is the reason and thus where is a bottleneck. A simple look at CFD backed with a quick scan of tickets in testing, however, will give you the answer.

    From this perspective, yes, you can still use CFD to find bottlenecks, yet don’t expect a definitive answer from a simple look at the diagram. As a matter of fact, even if you have a linear process a simple look at the diagram doesn’t give you a definitive answer either.

    It simply tells you where to look to find the actual answer.

    Having said that, I still discourage use loops in the workflow. I don’t deny a cyclical specifics of work–a feature can go back and forth between a developer and a tester–and yet how we define stations in our visualization may show it in a linear way, e.g. as testing & bug fixing altogether.

    Such an approach makes introduction of work in progress limits much, much easier. Loops, almost inevitably, introduce push element to otherwise pull process.

    Also, I’m yet to see a team where introducing loops to a visualized workflow was really necessary and there was no neat workaround.

  • Ewa September 18, 2017, 3:15 am

    Paweł, pamiętam Twój wykład (nie pamiętam gdzie to było) na którym prezentowałeś nam na żywo wykresy jak wyżej. W ramach lokalnej społeczności product ownerów pojawiła się w backlogu potrzeba warsztatów o metodach wizualizacji. Na szczęscie napisałeś ten artykuł i mogłam sobie odświeżyć tamten wykład. Niezwyle wartościowy materiał – dziękuję!!!
    Ewa

  • Marius Mans October 4, 2017, 8:06 am

    Wow…Wow…Wow

  • Juliano Ribeiro December 4, 2017, 10:30 am

    Hi, excellent post, a lot of very usefull information. I didn’t found anything like that in Brazilian Portuguese. Do you mind if I translate it (of course with the right credits)?

    Thanks

  • Pawel Brodzinski December 7, 2017, 3:07 am

    @Juliano – Please, feel free to go ahead with the translation.

  • Vinaya Muralidharan December 7, 2017, 9:22 pm

    Hi Pawel

    Excellent post and easy to understand. I am pointing more and more people to it:)

    Cheers,
    Vinaya

  • Bala December 23, 2017, 8:05 am

    Wow, an excellent blog about CFD. Learnt a lot to analyze the graphs using the scenarios given. Kudos to your vast coverage, Pawel. Very patient and great effort. Thank you so much !!

  • Karim Masarweh May 10, 2018, 7:22 am

    I just finished reading this for the first time.
    Before starting the 2nd reading, I wanted to say that this has to be the best blog post I’ve ever read in IT domain!
    Thank you so much Pawel for sharing your knowledge with us in such a professional and entertaining way.

  • Krasen September 14, 2018, 12:56 am

    Many thanks for the wonderful insight and CFO analysis. It was priceless information form me. Thank you!

  • Omg March 9, 2019, 7:40 pm

    This is one of the best articles I read regarding the ways to investigate the scrum team perform.
    Thank u!

  • Rodrigo Flores June 25, 2019, 12:16 pm

    Hi!

    Thanks for the article, I’m saving it as a reference on how CFD works :)

    Do you use any tool on your day to day to generate these flows ? I’m thinking about using Google Sheets.

    Also, do you recommend any scale for the time ? Is a day meaningful enough or do you recommend at least a week ?

  • Irene July 14, 2019, 1:47 pm

    Hi Pawel,
    Excellent Post and easy to understand, Thanks.

  • Pawel Brodzinski August 1, 2019, 7:35 am

    @Rodrigo – I used Google Sheets and MS Excel in the past, as well as plotting the charts manually on a whiteboard. As a rule of thumb: whatever is the simplest method that works would be fine.

    I typically use days as the granularity of time scale but at some level, e.g. epics, weeks may be more useful. It should be a function of how often something changes. If you only see changes twice a week, because you track epics and their average lead time is a month, it doesn’t make much sense to do daily snapshots for CFD. However, for the most common situation, where you build features and their typical lead time is a few days weekly snapshot would be insufficient to gather meaningful conclusions.

  • Andrea October 16, 2019, 5:45 am

    Pawel,

    Excellent post! I will certainly use it as reference material going forward. I’m wondering if you can give a description of how to use the CFD to predict when work will be completed. A forecasting tool.

  • Pawel Brodzinski October 16, 2019, 6:12 am

    @Andrea – The simplest method would be to linearly approximate the done curve to see where it would cross the backlog watermark. In fact, you may want to approximate the backlog curve too, as typically we discover new work items as the work progresses.

    This would be, however, a very simple forecast. It would be an equivalent of throughput approximation, i.e., how many items we complete in a time period.

    If you’d like to explore more options to forecast I can recommend you this article: https://blog.lunarlogic.io/2016/how-we-estimate-at-lunar-logic/

  • Alex January 13, 2020, 1:37 pm

    Not sure I get how can cumulative curve take a nose dive? It can flatten, yes, but go into subtraction mode? How? If we’ve done 10 tasks, as the time progresses we cannot all of a sudden find ourselves in the situation where, no, we have actually done 8 tasks. The original number (10 tasks) stays put, which means the Done curve flattens. But how can it go south?

  • Pawel Brodzinski January 14, 2020, 2:12 am

    @Alex – One example: tickets were marked done. Then, accidentally someone encounters a systemic problem that renders these tickets undone, i.e., more work is needed actually to complete the tickets, and thus, they go back into backlog or development.

    Another example: a ticket has been marked done, but for whatever reasons it didn’t meet done criteria, e.g., someone accidentally or purposefully didn’t validate all the things.

    Yet another example: there has been an error in gathering source data, either because the data gathering process is flawed or the data was wrong, e.g., the ticket has been accidentally moved.

    In theory, the done curve should never go down. In practice, CFD rarely looks like it should in theory.

  • Karuppiah Chidambaram October 30, 2020, 12:00 pm

    Pawel,
    Excellent blog about CFD. Learnt a lot to analyze the graphs using the scenarios given. One Clarification
    If the distance between the arrival curve and departure curves on a team’s cumulative flow diagram is growing apart, what is likely happening? Is that Lead Time increasing or WIP is decreasing;

  • Pawel Brodzinski November 2, 2020, 4:23 am

    @Karuppiah – It depends on whether it is vertical or horizontal distance. If the distance grows horizontally but not vertically it means that lead times get longer. If it grows vertically it means that WIP is increasing. If the gap grows on both accounts, which is the most common, it means that you face both issues at the same time.

  • Andreas Plath December 29, 2020, 12:28 am

    Dear Pawel,

    thank you very much for your article. 6,5 years old and still uptodate and very helpful. Do you mind if I translate it to German some time?

    All the best,

    Andreas

  • Paweł Brodziński January 7, 2021, 2:07 pm

    Andreas,
    Thank you1 Feel free to translate it as long as you quote the source.

  • Steve D February 2, 2021, 3:30 pm

    excellent job on explaining the CFDs!

  • baris bariseri February 7, 2022, 2:19 pm

    Well done. lovely to read it thanks

  • Brett Evans June 26, 2023, 8:30 am

    More than a decade old and still a article I reference and recomend on a regular basis!

Leave a Comment