Category: kanban

  • (Sub)Optimizing Cycle Time

    There is one thing we take almost for granted whenever analyzing how the work is done. It is Little’s Law. It says that:

    Average Cycle Time = Work in Progress / Throughput

    This simple formula tells us a lot about ways of optimizing work. And yes, there are a few approaches to achieve this. Obviously, there is more than the standard way, used so commonly, which is attacking throughput.

    A funny thing is that, even though it is a perfectly viable strategy to optimize work, the approach to improve throughput is often very, very naive and boils down just to throwing more people into a project. Most of the time it is plain stupid as we know from Brook’s Law that:

    Adding manpower to a late software project makes it later.

    By the way, reading Mythical Man-Month (the title essay) should be a prerequisite to get any project management-related job. Seriously.

    Anyway, these days, when we aim to optimize work, we often focus either on limiting WIP or reducing average cycle time. They both have a positive impact on the team’s results. Especially cycle time often looks appealing. After all, the faster we deliver the better, right?

    Um, not always.

    It all depends on how the work is done. One realization I had when I was cooking for the whole company was that I was consciously hurting my cycle time to deliver pizzas faster. Let me explain. The interesting part of the baking process looked like this:

    Considering that I’ve had enough ready-to-bake pizzas the first setp was putting a pizza into the oven, then it was baked, then I was pulling it out from the oven and serving. Considering that it was almost a standardized process we can assume standard times needed for each stage: half a minute for stuffing the oven with a pizza, 10 minutes of baking and a minute to serve the pizza.

    I was the only cook, but I wasn’t actively involved in the baking step, which is exactly what makes this case interesting. At the same time the oven was a bottleneck. What I ended up doing was protecting the bottleneck, meaning that I was trying to keep a pizza in the oven at all times.

    My flow looked like this: putting a pizza into the oven, waiting till it’s ready, taking it out, putting another pizza into the oven and only then serving the one which was baked. Basically the decision-making point was when a pizza was baked.

    One interesting thing is that a decision not to serve a pizza instantly after it was taken out of the oven also meant increasing work in progress. I pulled another pizza before making the first one done. One could say that I was another bottleneck as my activities were split between protecting the original bottleneck (the oven) and improving cycle time (serving a pizza). Anyway, that’s another story to share.

    Now, let’s look at cycle times:

    What we see on this picture is how many minutes elapsed since the whole thing started. You can see that each pizza was served a minute and a half after it was pulled out from the oven even though the serving part was only a minute long. It was because I was dealing with another pizza in the meantime. Average cycle time was 12 minutes.

    Now, what would happen if I tried to optimize cycle time and WIP? Obviously, I would serve pizza first and only then deal with another one.

    Again, the decision-making point is the same, only this time the decision is different. One thing we see already is that I can keep a lower WIP, as I get rid of the first pizza before pulling another one in. Would it be better? In fact, cycle times improve.

    This time, average cycle time is 11.5 minutes. Not a surprise since I got rid of a delay connected to dealing with the other pizza. So basically I improved WIP and average cycle time. Would it be better this way?

    No, not at all.

    In this very situation I’ve had a queue of people waiting to be fed. In other words the metric which was more interesting for me was lead time, not cycle time. I wanted to optimize people waiting time, so the time spent from order to delivery (lead time) and not simply processing time (cycle time). Let’s have one more look at the numbers. This time with lead time added.

    This is the scenario with protecting the bottleneck and worse cycle times.

    And this is one with optimized cycle times and lower WIP.

    In both cases lead time is counted as time elapsed from first second, so naturally with each consecutive pizza lead times are worse over time. Anyway, in the first case after four pizzas we have better average lead time (27.75 versus 28.75 minutes). This also means that I was able to deliver all these pizzas 2.5 minutes faster, so throughput of the system was also better. All that with worse cycle times and bigger WIP.

    An interesting observation is that average lead time wasn’t better from the very beginning. It became so only after the third pizza was delivered.

    When you think about it, it is obvious. Protecting a bottleneck does make sense when you operate in continuous manner.

    Anyway, am I trying to convince you that the whole thing with optimizing cycle times and reducing WIP is complete bollocks and you shouldn’t give a damn? No, I couldn’t be further from this. My point simply is that understanding how the work is done is crucial before you start messing with the process.

    As a rule of thumb, you can say that lower WIP and shorter cycle times are better, but only because so many companies have so ridiculous amounts of WIP and such insanely long cycle times that it’s safe advice in the vast majority of cases.

    If you are, however, in the business of making your team working efficiently, you had better start with understanding how the work is being done, as a single bottleneck can change the whole picture.

    One thought I had when writing this post was whether it translates to software projects at all. But then, I’ve recalled a number of teams that should think about exactly the same scenario. There are those which have the very same people dealing with analysis (prior to development) and testing (after development) or any other similar scenario. There are those that have a Jack-of-all-trades on board and always ask what the best thing to put his hands on is. There also are teams that are using external people part-time to cover for areas they don’t specialize in both upstream and downstream. Finally, there are functional teams juggling with many endeavors, trying to figure out which task is the most important to deal with at any given moment.

    So as long as I keep my stance on Kanban principles I urge you not to take any advice as a universal truth. Understand why it works and where it works and why it is (or it is not) applicable in your case.

    Because, after all, shorter cycle times and lower WIP limits are better. Except then they’re not.

  • Kitchen Kanban, or WIP Limits, Pull, Slack and Bottlenecks Explained

    Have you ever cooked for twenty people? If you have you know how different the process is when compared to preparing a dinner just for you and your spouse. A few days ago I was preparing lunch for folks in my company and I’m still amazed how naturally we use concepts of pull, WIP limits, bottlenecks and slack when we are in situations like this.

    I can’t help but wonder: why the hell can’t we use the same approach when dealing with our professional work?

    OK, so here I am, cooking 15 pizzas for a small crowd.

    Bottlenecks

    If you read Eli Goldratt’s The Goal you know that if you want to make the whole flow efficient you need to identify and protect bottlenecks. Having some experience with preparing pizzas for a few people, I easily guessed that the bottleneck would be an oven.

    The more interesting part is how, knowing what is the bottleneck, we automatically start protecting it. The very next thing I was doing after taking a pizza out from the oven was putting another one in. If I decided to serve the pizza first I would be making my bottleneck resource (the oven) idle, which would affect the whole process and its length.

    Interestingly enough, protecting the bottleneck in this case resulted in longer cycle time and, with the first delivery, worse lead time too. That’s the subject for another story though.

    The lesson here is about dealing with bottlenecked parts of our processes. One of the recent conversations I’ve had was about bringing more developers into a project where business analysis was a bottleneck. It would be like hiring waiters to help me serving pizzas and expecting it would make the whole process faster.

    It’s even worse if you don’t know what your bottleneck is. In the story with business analysis I’ve mentioned the team learned where the problem is only after some time into the project. Before that they would actually be willing to hire more waiters and would expect that would improve the situation.

    WIP Limits

    Fifteen pizzas and one cook. If I acted as an average software development team I would prepare dough for all pizzas, then move to a tomato sauce, then to other ingredients. Three hours later I would realize that, because of a system constraint, I can’t bake in batch. I would switch my efforts to deal with a hungry and angry crowd focusing more on dealing with their dissatisfaction than on delivering value. Fortunately, eventually I would run a retrospective where I would learn that I made a mistake with the baking part so I would file a retro summary into a place no one ever looks again and congratulate myself a heroic effort of dealing with hungry clients.

    Instead I limited amount of work invested into preparing dough and ingredients. I prepared enough to keep the oven running all the time.

    Well, actually I prepared more. I started with WIP limit of 6 pizzas, meaning that I had 6 ready-to-bake pizzas when the oven was ready. Very soon I realized one obvious and two more, less obvious, issues with such a big WIP limit.

    First, 6 pizzas take up a lot of space. Space which was limited. Even more so, when more people popped up in the kitchen waiting for their share. This is basically a cost of inventory. Unfortunately, in the software industry we deal with code so we don’t really see how it stacks up and take up space, until it’s too late and fixing a bug becomes a dreadful task no one is willing to undertake.

    If only we had to find a place to store tiny physical zeros and ones for each bit of our code… The industry would rock and roll.

    The other two issues weren’t that painful. If you keep unbaked pizza too long it’s not that good as it’s a bit too dry after baking. I also realized that I could easily manage to prepare new pizzas at a pace that doesn’t require such a big queue in front of the oven. I could prepare better (fresher) product and it still wouldn’t affect the flow.

    So I quickly reduced my queue of pizzas in front of the oven to 4, 3 and eventually 2. Sure, it changed how I worked, but it also made me more flexible. I didn’t need so much space and could react to special requests pretty flexibly.

    Surprisingly enough, WIP limits in a kitchen seem so intuitive. It’s often more convenient to work in small batches. Such an approach helps to focus on the bottleneck. If you’re dealing with physical inventory you also virtually see the cost of excessive inventory. Unfortunately, with code it’s not that visible even though it’s a liability too.

    It doesn’t mean that the whole mechanism changes dramatically. Much unfinished work increases multitasking, inflicts a cost of context switching, lengthens feedback loops. It just isn’t that visible, which is why we don’t naturally limit work in progress.

    Slack Time

    When we are talking about WIP limits we can’t forget about slack time. Technically I could prepare an infinite queue of ready-to-bake pizzas in front of the oven. Of course no mentally healthy cook would do this.

    Anyway, when I started limiting my pizzas in progress I was facing moments when, in theory, I could have been preparing another one but didn’t. I didn’t, even when there was nothing else to be done at the moment.

    A canonical example of slack time.

    I used my slack time to chat with people, so I was happier (and we know that happy people do a better job). I got myself a coffee so I improved my energy level. I also used slack to rearrange the process a bit so my work was about to become more efficient. Finally, slack time was an occasion to check remaining ingredients to learn what pizzas I can still deliver.

    In short I was doing anything but pushing more work to the system. It wouldn’t help anyways as I was bottlenecked by the oven and knew my pace well enough to come up with reasonable, yet safe, WIP limits which were telling me when I should start preparing the next pizza.

    There are two lessons for us here. First, learn how the work is being done in your case. This knowledge is a prerequisite to do reasonable work with setting WIP limits. And yes, the best way to learn what WIP limits are reasonable in a specific case is experimenting to see what works and what allows to keep the pace of the flow.

    Second, slack time doesn’t mean idle time. Most of the time it is used to do meaningful stuff, very often system improvements that result in better efficiency. When all people hear from my argument for slack time is “sometimes it’s better to sip coffee than to write code” I don’t know whether I should laugh or cry. It seems they don’t even try to understand, let alone measure, the work their teams do.

    Pull

    And, finally, pull principle. As we already know the critical part of the whole process was the oven, let’s start there. Whenever I took out a pizza from the oven it was a signal to pull another pizza into the oven. Doing this I was freeing one space in my queue of pizzas in front of the oven. It was a pull signal to prepare another one. To do this I pulled dough, tomato sauce and the rest of ingredients. When I ran out of any of these I pulled more of them from fridge.

    Pull all over the place. Getting everything on demand. I was chopping vegetables or opening the next pack of salami only when I needed them. There were almost no leftovers.

    Assuming that I could replenish almost every ingredient during the time a pizza was being baked, I was safe. I could even base on an assumption that it’s close to impossible that I run out of all the ingredients at the same time. And even then I had a buffer of ready-to-bake pizzas.

    The only exception was dough as preparing dough took more time. Dough was my epic story. This part of the work was common for a bunch of pizzas all derived from the same batch of dough. Same like stories derived from an epic. In this case I was just monitoring the inventory of dough so I could start preparing the next batch soon enough. Again, there was a pull signal but it was a bit different: there are only two pieces of dough left; I should start preparing another batch so it would be ready once I run out of the current one.

    The lesson about pull is that we should think about the work we do “from right to left.” We should start with work items that are closest to being done and consider how we can get them closer to completion. Then, going from there, we’ll be able to pull work throughout the whole process as with each pull we’ll be creating free space upstream.

    Once we deploy something we create free space so we can pull something to acceptance testing. As a result we free some space in testing and pull features that are developed, which makes it possible to pull more work from a backlog, etc.

    When using this approach along with WIP limits we don’t introduce extensive amount of work to the system and we keep our flow efficient.

    Once we learn that earlier stages of work may require more time than later ones we may adjust pull signals and WIP limits accordingly so we keep the pace of the flow.

    Summary

    I hope the story makes it easier to understand basic concepts introduced by Kanban. Actually, I’d say that if software was physical people would understand concepts of flow, WIP limits, pull or protecting bottlenecks way easier. They would see how their undelivered code clutter their workspace, impact their pace and affects their flow of work.

    So how about this: ask yourself following questions.
    Where is the oven in your team?
    Who is working on this part of the process?
    Do you protect them?
    How many ready-to-bake pizzas do you have typically?
    How many of these do you really need?
    What do you do when you can’t put another pizza into the oven?
    What kind of space do your pizzas occupy?
    Do your pizzas taste the same, no matter how long they are queued?
    Do you need all the ingredients prepared up front?
    How much of ingredients do you typically have prepared?
    How do you know whether you need dough and when you should start preparing it?

    Look at your work from this perspective and tell me whether it helps you to understand your work better. It definitely does in my case, so do expect further pizza stories in the future.

  • WIP Limits Revisited

    One of things you can hear repeatedly from me is why we should limit work in progress (WIP) and how it drives continuous improvement. What’s more, I usually advise using rather aggressive WIP limits. The point is that you should generate enough slack time to create space and incentive for improvements.

    In other words, the goal is to make people not doing project or product development work quite frequently. Only then, freed from being busy with regular stuff, they can improve the system which they’re part of.

    The part which I was paying little attention to was the cost of introducing slack time. After all, these are very rare occasions when clients pay us for improvement work, so this is some sort of investment that doesn’t come for free.

    This is why Don Reinertsen’s sessions during Lean Kanban Europe Tour felt, at first, so unaligned with my experience. Don advises to start with WIP limits twice as big as average WIP in the system. This means you barely generate any slack at all. What the heck?

    Let’s start with a handful of numbers. Don Reinertsen points that WIP limit which is twice as big as average WIP, when compared to no WIP limit at all, ends up with only 1% idle time more and only 1% rejected work. As a result we get 28% improvement in average cycle time. Quite an impressive change for a very small price. Unfortunately, down the road, we pay more and more for further improvements in cycle time, thus the question: how far should we drive WIP limits?

    The further we go the more frequently we have idle time, thus we waste more money. Or do we? Actually, we are doing it on purpose. Introducing slack to the system creates an opportunity to improve. It’s not really idle time.

    Instead of comparing value of project or product work to idle time we should compare it to value of improvement work. The price we pay isn’t that high as it would initially seem basing simply on queuing theory.

    Well, almost. If we look at the situation within strict borders of a single project value of improvement work is non-existent or intangible at best. How much better will the product be or how much faster will we build remaining features? You don’t know. So you can’t say how much value these improvements will add to the project.

    However, saying that the improvements are of no value would be looking from a perspective of optimizing a part; in this case a single project. Often impact of such improvements will be broader than within borders of the project and it will last longer than the project’s time span.

    I don’t say I have a method you may use to evaluate cost and value attached to non-project work. If I had I’d probably be a published author by now, had lots of grey hair and a beer belly twice as big. My point is that you definitely shouldn’t account all non-project work as waste. Actually, most of the time cost of this work will be smaller than value you get out of it.

    If we based purely on Don Reinertsen’s data and assumed that whenever we hit WIP limit people are idle we could come up with such a chart:

    On a horizontal axis we have WIP limits going from infinite (no WIP limit at all) to aggressive WIP limits inflicting much slack time. On a vertical axis we have overall impact on a system. As we introduce WIP limits (we go to the right side of the chart) we gain value thanks to shorter average cycle times and, at least at the beginning, improved throughput. At the same time we pay the cost of delay of rejected or queued work waiting to enter the system (in backlog) and the cost of idle time.

    In this case we reach the peak point of the curve pretty quickly, which means that we get most value with rather loose WIP limits. We don’t want to introduce too much idle time to the system as it’s our liability.

    However, if we start thinking in terms of slack time, not idle time, and assume that we are able to produce enough value during slack time to compensate the cost the chart will be much different.

    In the case number two the only factor working against us is cost of delay of work we can’t start because of WIP limits. The organization still has to pay for people doing non-project work, but we base on assumption that they create equal value during slack time.

    The peak of the curve is further to the right, which means that the best possible impact happens when we use more aggressive WIP limits than in the first case.

    Personally, I’d go even further. Basing on my past experience I’d speculate that often slack time results in improvements that have positive overall impact on the organization. In other words it would be quite a good idea to fund them as projects as they simply bring or save money. It gives us another scenario.

    In this case impact of slack time is positive so it partially compensates increasing cost of delay, as we block more items to enter the system. Eventually, of course, overall impact is negative in each case as at the end of horizontal axis we’d have WIP limit of 0, which would mean infinite cost of delay.

    Anyway, the more interesting point to look at is the peak of each curve, as this is a sweet spot for our WIP limits. And this is something we should be looking for.

    I guess, by this time you’ve already noticed that there are no numbers on the charts. Obviously, there can’t be any. Specific WIP limits would depend on a number of context-dependent factors, like a team size, process complexity or external dependencies, to mention only the most obvious ones.

    The shape of curves will depend on the context as well. Depending on the work you do cost of delay can have different impact, same as value of improvements will differ. Not to mention that cost attached to slack time vary as well.

    What I’m trying to show here is that introducing WIP limits isn’t just a simple equation. It’s not without a reason that no credible person would simply give you a number as an answer for a question about WIP limits. You just have to find out by yourself.

    By the way, the whole background I drew here is also an answer for the question why my experience seemed so unaligned with ideas shared by Don Reinertsen. I just usually see quite a lot value gained thanks to wise use of slack time. And slack time, by all means, should be accounted differently than idle time.

  • Kanban Coaching Professional

    Frequent visitors might have noticed a new banner on the sidebar of the blog that says “Kanban Coaching Professional.” It might come as a surprise that I’ve decided to join the Kanban Coaching Professional program. After all, I used the word certifiction (no typo here) repeatedly, shared my concerns about the idea of certifying anything around Kanban and even showed my hatred to any certification at all. And now, I jump on KCP bandwagon.

    Why, oh why?

    Well, I must admit I like a couple things in the approach David Anderson and Lean Kanban University have chosen in the program. Peer review is one. To get through the process and become a Kanban Coaching Professional, you need to talk with folks who know the stuff.

    On one hand it sounds sort of sectarian – we won’t let you in unless we like you. On the other, it is just a good old recommendation process. I trust Mike Burrows so I trust people who Mike trusts, etc. This way the title means something more than just a participation trophy. Also, the seed people who will be running the decision-making process are very decent.

    There is a risk of leaving some people behind – those who are not active members of the Kanban community but are otherwise knowledgeable and smart folks. Well, I really do hope it won’t become some sort of coven who doesn’t let fresh blood in. It definitely is a risk Lean Kanban University should pay close attention to.

    Another thing I like is that there’s been an option to be grandfathered into the program. By the way, otherwise I wouldn’t be a part of this. I just don’t feel like attending a course just to be approved. That’s just not my way of doing things.

    I prefer to write and speak regularly about Kanban, showing that I do and know the stuff, instead of attending the course. Yeah, this is a hard way but it’s just the way I prefer. With such an attitude, there’s no way I’m going to be CSM, but it seems the Kanban community has some appreciation for non-standard cases such as myself.

    Actually, I hope this option will be kept open. I mean I can imagine great people with an attitude similar to mine – willing to get their hands dirty (and prove it) – but not really willing to attend the course.

    Because, when we are on the course, I’m not a fan of this requirement. I understand it is there for a reason and, to be honest, I don’t think I have a better idea for now, but I have the comfort of standing at the sideline and saying “I don’t like it.”

    I guess it is supposed to be a business, so there needs to be a way of making money out of it. For the time being though, not the business which I’m a part of.

    However, the simple reason that I could, and rather easily, become a Kanban Coaching Professional isn’t why I decided to give it a go. After all you still need pay some money for this, so we’re back to the question: “Why?”

    As Kanban gets more and more popular, I see more people jumping on this bandwagon, offering training, coaching and what have you. The problem is that sometimes I know these people and I’m rather scared that they are teaching Kanban.

    Not that I want to forbid anyone to teach Kanban, but I believe we arrived to the point where we need a distinction. The distinction between people who invest their time to keep in touch with the community, attend events, share experience, engage discussions, etc. and those who just add a Kanban course to their wide training portfolio because, well, people want to buy this crap.

    This is exactly why I decided to get enrolled in the KCP program. For this very distinction.

    I believe that, at least for now, it differentiates people who you’d like to hire to help you with Kanban from those who you can’t really tell anything about. This is where I see the biggest value of KCP. I really do hope it will stay this way.

    Unless the situation changes the banner will hang there on the sidebar and I will use KCP title as a confirmation of my experience and knowledge about Kanban. Sounded a bit pompous, didn’t it? Anyway, if you look for help with Kanban, pay attention to these banners or KCP titles.

  • Radar Charts and Maturity of Kanban Implementations

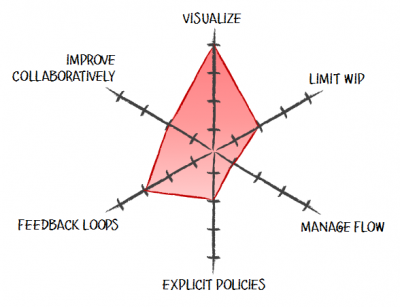
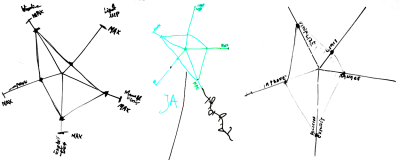
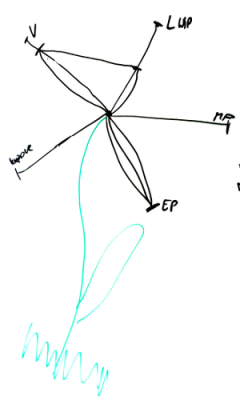
    One of outcomes of Hakan Forss’ session on depth of Kanban practices at the Kanban Leadership Retreat was the use of radar charts to show the maturity of a Kanban implementation. The whole discussion started with the realization that different teams adopt Kanban practices in different orders, thus we need a tool to assess them somehow.

    Radar charts, or spider charts, seem to be good tools for visualizing how well a team is doing. However, when you start using them, interesting things pop up.

    Coming Up with Results

    First, how exactly do you tell how mature an adoption of a specific practice is? How far are we on a scale from 0 to 5 with visualization? Why? What about limiting work in progress? Etc.

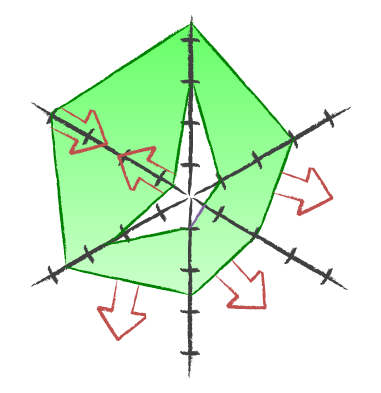
    One of my teams decided to describe 0 as “doing nothing” and max as “where we think we would like to be.” With such an approach, a radar chart can be treated as a motivational poster – it shows exactly how much we still should do with our Kanban implementation. It also means that the team aims at a moving target – as time passes they will likely improve and thus set more ambitious goals.

    There is also a drawback to this approach. Such an assessment is very subjective and very prone to gaps in knowledge. If I think that everything there is to be done about WIP limits is to set those numbers in each column on the board and avoid violating them, I will easily hit the max on the “limiting WIP” axis. Then of course I’ll award myself the Optimist of the Week and Ignorant of the Month prizes, but that’s another story.

    On a side note: I pretty much expect that someone is going to come up with some kind of a poll with a bunch of questions that do the job for you and tell you how far you are with each practice. And, similarly to the Nokia Test, I think it will be a very mixed blessing with negatives outweighing positives.

    Finding Common Results

    The second issue is about gathering collective knowledge from a team. People will likely differ in their judgment – one would say that visualization is really mature, while the other will state that there’s lot more to be done in there.

    The obvious strategy is to discuss the areas where the differences are the biggest. However, it’s not a fancy flavor of planning poker so, for heaven’s sake, don’t try to make everyone agree on the same number. It is subjective after all.

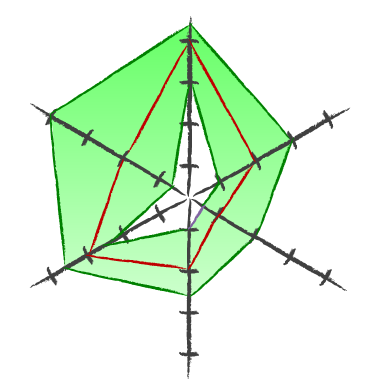
    One more interesting trick that can be done is putting all the results on a single radar chart with min and max values creating the borders of an area. This area will tell you how your Kanban implementation is perceived.

    With such a graph not only do you want to have this bagel spread as far as possible but also to have it as thin as possible. The latter may be even a more important goal in closer perspective as a wide spread of results means that team members understand the tool they use very differently.

    Comparing Results between Teams

    The third issue pops up when you compare graphs created by different teams. Let’s assume you have both issues above solved already and you have some kind of consistent way of judging maturity of Kanban practices. It is still very likely that different teams will follow different paths to Kanban adoption, thus their charts will differ. After all this is what launched the whole discussion in the first place.

    It means, however, that you may draw very interesting conclusions from comparing the results of different teams. You don’t try to say which team is better and which needs more work. You actually launch discussions on how people are doing things and why they think they are good (or bad) at them. You enable collaborative learning.

    As a bonus you can see patterns on a higher level. For example, people across the organization are doing pretty well with visualization, have very mixed outcomes in terms of managing flow and are not that good when it comes to limiting WIP. It can help you focus on specific areas with your coaching and training effort.

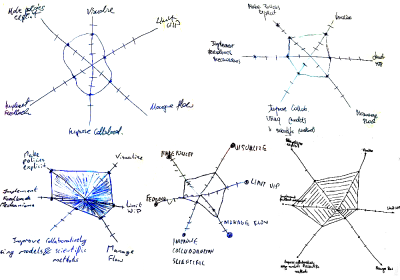
    Besides, it is funny to see how a personal kanban maturity radar chart can look like.

    To summarize, radar charts are nice visuals to show you where you are with your Kanban adoption, but they may, and should, be used as a communication enabler and a learning catalyst.

  • Pitfalls of Kanban Series: Stalled Board

    One of signals that something may be wrong with a Kanban implementation is when the Kanban board’s design doesn’t change over time. Of course it is more likely that rapid changes of the board will be happening during early stages of the Kanban implementation, but even in mature teams a board that looks exactly like it did a year ago is sort of a warning light. For very fresh Kanban teams I would expect that board design would differ month-to-month.

    Actually, a stalled board is more a symptom than a problem on its own. The root cause is likely the fact that the team stopped improving their process. On one hand, it is a common situation that at the beginning the potential for change is significantly higher and it diminishes over time. On the other, I’ve yet to see a perfect team that doesn’t need to improve their processes at all.

    In such cases, what can one do to catalyze opportunities to discuss the board design?

    One idea that comes in very handy is to watch for situations in which any team member takes an index card to update its status and, for whatever reasons, struggles to find the right place on the board to put the card. It may be so because there isn’t relevant stage in the value stream, or the work currently done isn’t in line with the rest of process, or a task is sort of specific, or what have you. This kind of situation is a great trigger to start a discussion on the board’s alignment to what the team really does and how the work is done.

    Another idea is to dedicate a retrospective just to discuss the board. Such a constrained retro can be a natural opportunity to look for board-related issues or improvements in this area. I think about a class of issues that might not be painful enough to be brought as biggest problems to solve on regular basis, but, at the same time, we know that tiny changes in the board design or WIP limits can introduce tremendous changes in people’s behavior.

    There is also a bigger gun – a significant board face-lift. Following the idea that Jim Benson shared during his ACE Conference keynote, teams find it easy to describe and define about 80% of processes they follow. The rest seems vague and that’s always a tricky part when you think about value stream mapping. This is, by the way, totally aligned with my experience with such exercises – I’ve yet to meet a team that can define the way they work instantly and without arguing.

    Of course, introduction of visualization helps to sort this one out although it’s not that rare that we fall into a trap of idealizing our flow or just getting used to whatever is on the board.

    Then you can always use the ultimate weapon and redesign your board from scratch. Probably people will have in mind the board you’ve just wiped out and will mimic it to some point. Anyway, odds are that if you start a discussion from the beginning – the moment when work items of different classes of services arrive to the team –some new insight will pop up, helping you to improve the board.

    On a side note: it is also a good moment to discuss what you put on an index card exactly; I treat it as an integral part of board design, as you will need a different design for standard-sized work items and different for highly-variable projects on portfolio board.

    Read the whole Kanban pitfalls series.

  • Visualization Should Be Alive

    I’ve had a great discussion recently. A starting point was information from Kanban board – basing on my knowledge it wasn’t up to date and, as it appeared later, it wasn’t without a reason. A way of visualizing how situation looked like in a team was sort of tricky.

    We used the situation to discuss in details what is happening and how we should visualize it. Anyway, one thing struck me in retrospect – the less visualization changes the fewer chances we have to start such discussions.

    A good (or rather a bad) example is my portfolio Kanban board. Considering I try to visualize there projects of different sizes it’s not that uncommon when, in the long run, there are few changes on the board. On one hand, this is acceptable and even expected. On the other, there aren’t enough “call for action” situations when people are expected to do something, like moving stickies etc. Those situations that trigger important discussions.

    This is also why I prefer Kanban boards that are built of rather small-sized work items than those that are filled with huge tasks. They just aren’t that lively. They tend to stall.

    And when visualization stalls its value diminishes. People tend to develop a specific kind of blindness. They start treating their information radiator just like another piece of furniture, which results in the board being exactly that – a piece of furniture. Not useful in terms of improving team’s work.

    So remember this: as long as you expect visualization to generate value, it should live. If it doesn’t, think how you can make livelier. You won’t regret.

  • Pitfalls of Kanban Series: Wishful Thinking

    I find it pretty common that teams who adopt Kanban try to draw the ideal process on their boards. Not exactly the one they really follow, but the one they’d like to. It is thinking taken from prescriptive methods – since we have this ideal process we want to implement let’s just draw it so we know where we are heading to.

    Bad news is that Kanban in general, and Kanban board specifically, doesn’t work that way. You may draw pretty much any process on your Kanban board, a better or a worse one, too detailed or too generic, or just simply different. However in each case data you get from the board won’t reflect reality.

    The end result is pretty simple as with the board that is not up to date people will be making their everyday project decisions basing on a lie.

    What more, drawing the ideal process on the board instead of one that team really follows brings additional pains. People are confused when it comes to work with the board, e.g. I’m supposed to do code review but I haven’t and won’t do it but hey, I should put an index card here because our process on the board says so.

    As a result it is way harder to show value of Kanban board, people lose interest in updating it and whole Kanban implementation quickly deteriorates.

    The first step to deal with the problem is admitting your process is less-than-ideal. Pretty often it means admitting your process is simply crappy. As funny as it may sound teams find it really hard to go past this step. We wish we were better and this wishful thinking blinds us.

    Then it’s time to adjust the board so it reflects the way team works. It may be painful. I saw teams throwing out code review stage. I saw those throwing out all the testing stages. That didn’t mean they didn’t want to review code or test. That meant they weren’t able to do it consequently for majority of features they built.

    Note: at this stage a pressure from the top may appear. How come that you aren’t testing? That’s outrageous! That just cannot be! Well, it is, so better get used to it for a time being because drawing the ideal process on the Kanban board is almost as useful as drawing unicorns there. If such pressure appears, you definitely want to resist it.

    The final stage is continuous evolutionary improvement. If you track down root causes of suboptimal process you will likely find that your flow is unbalanced. If you want to balance the flow slack time and WIP limits should be your best friends. Treat them seriously. Don’t violate limits; don’t get tempted to use slack time to build new features.

    This change won’t be fast but at least odds are it will be successful. Drawing results of your wishful thinking on the Kanban board will fail for sure.

    Read the whole Kanban Pitfalls series.

  • Kanban and Behavioral Change

    One of my favorite and yet most surprising things I learned about Kanban over the years is how it steers change of behavior among mature teams. It shouldn’t be a surprise that at Kanban Leadership Retreat (#klrat) I ended up facilitating a session covering this area.

    Those of you familiar with #klrat format would understand me when I say I didn’t have any specific expected outcome of the session. I wanted to start with exchanging stories and see how it goes. Maybe we would be able to observe some patterns of behavioral changes steered by Kanban and learn from that.

    Fast forward to what we ended up with. For me it is still work in progress, so will see more on the subject soon. Anyway I pushed my thinking forward in terms of how we can stimulate our teams to improve.

    One thing you instantly notice on the picture with the session summary (click to enlarge) is that there despite the fact we were gathering unrelated stories we started building a chain of dependencies. Another observation is how frequently visualization pops up in different examples.

    What I believe we will be able to build is sort of a graph showing what kind of behavioral changes can be influenced or even incentivized with adopting specific practices. What more, I don’t want to keep it purely about Kanban. Although at #klrat Kanban context was set by design I’m pretty sure we can, and should, go beyond this context.

    A few highlight from the session, basing on stories we’ve shared:

    • Visualization combined with WIP limits and daily meetings around the board improve general team-wide knowledge about what’s happening. In short term this influence how people deal everyday tasks, encouraging them to get involved in work done by others, thus removing personal queues. As a result it pulls people toward generalization as they’re involved in many different tasks.
    • Visualization and measuring flow improves understanding of work. It makes people to focus on pain points and incentivize them to improve problematic areas. As a result a team takes more responsibility for how the work is done.
    • Rich visualization along with slack available to people results in better decisions and better use of slack time. It bases on a notion that rich visualization derives more meaningful data so whenever people decide what to do, especially when they aren’t constrained, e.g. when they’re using slack, improves the quality or potential outcome of these decisions. The final effect is building team’s collective intelligence both in terms of what they do and how they do it.
    • Making visualization fun fuels viral adoption of the method. It bases on a fact that people like having fun with tools they use. More fun means more people trying to find out what this cool thing is and how to use it. Eventually you get more people willing to introduce the method and better attitude toward the adoption.
    • Measuring flow (again) and understanding and visualizing (again) the nature of work can have impact in a multiple ways: creating incentive to change, building trust to a team and getting rid of 100% utilization. A simple fact that we were able to address so many effects to improved understanding how we work is a strong indicator that we do have problems with that. We might be onto something here.
    • Avoiding 100% utilization and slack time, which is generated this way, may be a tool to build leadership among the team (people are free to make decisions on what’s being done) and at the same time can improve fun factor (people can choose to work on fun stuff). In both cases we strengthen our teams and develop people.

    By the way: if you add a real story to each of these highlights you may imagine the experience we exposed ourselves to.

    In retrospect, one thing that is definitely worth stressing is how little we seem to know about nature of our work. Actually if you think about it, Kanban deals with this issue in a very comprehensive way.

    Visualization vastly improves information availability so we know better what is happening. Explicit policies force us to define, or agree on, the way we do work. Without explicit discussions on that we often believe we know how exactly how the work is done even when it’s clearly not true. Then we have flow management with a focus on measures that can change our perception of work highly. It’s a common situation when, being an outsider basing on a handful of simple measures, you can surprise a team showing them specifics of their work.

    If that wasn’t enough we get WIP limits that steer changes in the nature of work and give us an important lesson about nature of work in general.

    Anyway, leaving tools aside the lesson is to invest more effort to understanding how we work. It will pay off.

  • Slacker Manifesto

    We are professionals, we take pride of our work and we pursue continuous improvement. Most of all we learn.

    One thing we’ve learned is that pursuing 100% utilization is a myth and a harmful one. Another thing we’ve learned is value of slack time. Building on that, hereby we declare ourselves Slackers.

    And here is our Manifesto (you can sign it by leaving a comment if you like to).

    Slacker Manifesto

    On occasions we do nothing. Or something different. Or else.

    Because this means that our teams are more effective.

    It also means that we are freaking awesome.

    Signatories:
    Full list of signatories can be found here — in a stand-alone copy of Slacker Manifesto.

    Big thanks to Kate Terlecka and Andrzej Lorenz who influenced creation of this masterpiece highly.