
I’m not a fan of estimation. I try to avoid it when I can. However, I’m not orthodox. I won’t be telling everyone that refusing to estimate is the way to go.
I admit that I’m now in a comfortable land of time and material contracts that give more flexibility to the clients and more safety to the vendors at the price of mutual trust. At the same time Lunar Logic is the first of my jobs that works this way, so I’m more than familiar with fixed everything sort of contracts too. In that world estimate is a king. A lousy king though.
Despite the fact, that fixed price projects are a nightmare from my past life, we can’t forget about estimation at all. Even those awesome folks we started working with recently started with asking us to deliver estimate in story points or other abstract measure of our choice.
I intended to track progress in the project with Cumulative Flow Diagram (CFD) that counts only a number of tasks completed. However, having individual estimates for all the stories in backlog it’s easy to have two CFDs: one tracking a number of stories and tasks and the other that refers to initial estimates.
One might suppose that it would be basically the same data on both charts. And one would be wrong.
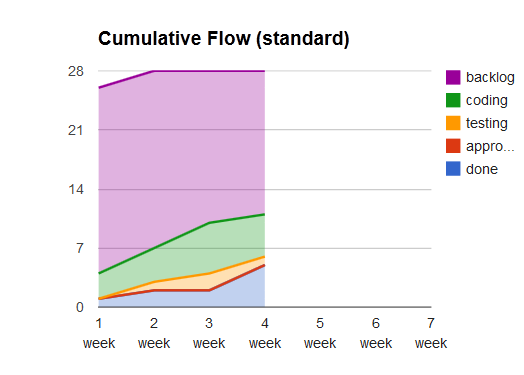
Let’s start with the charts. Here’s standard CFD for the first few weeks.
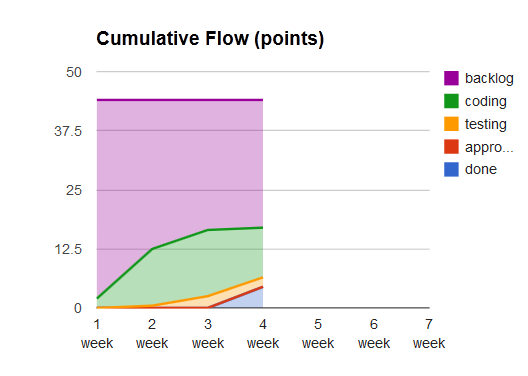
And here’s CFD that bases on estimates in story points.
What’s the difference? In fact, there are quite a few of them.
For the starters, the scope changed only on the first chart. What does it mean? Simply that despite no change in total points there were new tasks. In this case almost all of them were non-functional tasks like setting up the environment, design pre-processing and adjustments in existing code that enables integration with the new part of an application.
There was also a split of one of stories to a couple of them for the convenience. The total estimate didn’t change although there was a new story to build.
Another thing you may notice is that on the second chart we’ve finished anything pretty late in the project, while the standard CFD shows completion of a couple of features early. Again it is connected with non-value-adding and non-functional features that had to be completed to get the team running.
Finally, and most interestingly, try to judge amount of work in progress and size of stories in progress looking at the charts. A hint: you will find the answer to the former in the first and to the latter on the second chart.
Standard CFD tells you that we care about limiting WIP and avoid starting too much. The story point-driven chart shares a different story. Steepness of the coding curve indicates that we’ve started with heavy features. In this case heaviness was mostly driven by risks – the heaviest features were most risky ones. We decided to start with them to address risks pretty early in the process so if there’s a screw up on the way we know it as soon as possible.
By the way, I don’t focus here on the data that you specifically get from CFD. You could draw exactly the same conclusions if you used burnup charts, which are gateway drug to Cumulative Flow Diagrams.
Obviously, CFD can tell you a bit more, e.g. about the awesomeness of the client, as they don’t ever have anything stacked in approval. Whatever is ready it gets verified and accepted.
Anyway, the point is that despite I don’t feel that detailed estimates in this project really pushed us further (maybe despite building trust relationship, but that’s a different story) we can still use the work invested in estimation to learn something.
And, as you see, you can learn quite a bit using very simple tools.
 Subscribe RSS feed
 Follow on Twitter
 Subscribe by email


7 comments… add one
Aren’t time and materials even worse than fixed price? Not only do you have to estimate, but you have to track time as well, and it discourages people from finding more effective ways of working. Then you have to explain why the bill is always larger than the estimate. The customer loses trust and the developers worry about not working as fast as “promised” and start feeling pressure to cut corners.
We use time & materials and are trying to move away from it.
@Kurt – My experience is very different. I see, however, how time and material may end up the way you describe. If you don’t assume trust between the vendor and the client, well, yes, it’s tricky. But then it the same with fixed price contract too.
If you base on openness, transparency and trust, it’s exactly opposite. Time and material removes fixed deadlines from a project and creates opportunities for the client to actively work on the scope. It discourages wars over the specification. It creates better environment for craftsmanship as, well, there’s no fixed deadline to bite you in the butt.
It all starts with trust though.
And even earlier, with vendor’s willingness to walk away from a deal when no trust can be assumed.
I know few companies have a comfort of refusing to work with clients that enforce toxic work environment. But don’t blame the contract type. Blame the relationship with the client (which both sides are responsible for).
If the price I’d have to pay for continuing to work with a client was to compromise quality, I’m not going to do it, even if that means that the client walks away at the end of the day. It’s just a matter of principles.
And I don’t agree with one thing you’ve written particularly: “The customer loses trust and the developers worry about not working as fast as promised…” No, the customer doesn’t lose trust. There wasn’t trust in the first place so they can’t lose it now.
@Kurt – Also, you may find this Paul Klipp’s post, as well as comments below, interesting.
@Pawel, looking at these CFD charts I got qurious what would look like estimated vs actual delivered value. Are you tracking something like that too?
@Yavor – Much depends how you define value. In this very case we didn’t know the whole context so I wouldn’t even try to decide which feature was of bigger value than the other.
Given what I knew I would say that if I filtered standard CFD so it doesn’t show “technical” tasks (setting up the environment, cutting psds, etc.) or bugs it would be exactly value delivery chart. Estimated value would be a number of value-adding features we’ve had at the beginning, but over the course of the project it would fluctuate, e.g. go down if we resign from building a feature (this actually happened) or up if we add new stuff (this obviously happened too).
Yes, things depend much on value definition.
I mostly curious exactly about tasks like technical/infrastructure ones, analysis/clarification and/or break down of features, investigating complicated external interfaces, clarifying requirements… We have such things mixed on same board with normal implementation tasks: and despite of the many tasks moved to “Done” – they’re mostly preparation, investigation and some docs kind of work for now. So seems important to better see what kind of work is flowing through thte system and what is the “net” outcome.
@Yavor – As stated before, for value delivery I would ignore all sorts of non-value-adding work and then just count features. Unless you are so much “inside” the product that you can tell the difference of value of delivering different features.
My personal perspective: preparation, technical tasks or going through the early stages of a learning curve doesn’t count as value-adding even though usually it has to be done. On the other hand it is good to know that there is some non-value-adding work that just has to be done, and that’s exactly where standard CFD comes for the rescue.
Most projects follow (italics) S-curve in terms of value delivery but (italics) J-curve in terms of efficiency.