
One of the discussions that happened during Don Reinertsen’s product development workshop was the one about absorbing turbulence. Absorbing turbulence is a metaphor for how well a team deals with unplanned variability of the process. These would be situations like arrival of a bigger batch of features to build, or especially complex work items, etc.
Normally, every team is suitable to absorb some turbulence. Beyond that point this capability will not be sufficient and the situation would quickly escalate. A good example may be that the team would gracefully deal with some additional features but above certain threshold we’ll quickly the situation escalating to a high queue state. This would result in long lead times, long feedback loops and generally decreased responsiveness of a team.
These all result in lower efficiency too.
If such a situation persists over longer period of time it can take a heavy toll on people as we are running at risk of burning people out.
I really like the analogy that Don uses in his work: when a human body is losing blood, interestingly enough, blood pressure doesn’t go down. What our body is designed for is to pump enough blood to the brain so it can operate normally.
To compensate for losing blood the heart rate keeps going up. It goes up to the point where this mechanism is no longer sufficient and the organism crashes over a very short period of time.
A similar thing happens when we overload our teams. For some time they deal with the overload just fine introducing their own coping mechanism. They’d likely work overtime, introduce additional multitasking, etc. A problem is that, similarly to the situation when a human body loses blood, there’s a price to be paid for that.
Eventually people end up burned out and leave an organization. From that perspective a good question would be: what kind of early signals we get so that we can address the problem early.
One answer would be careful monitoring of work. How much work in progress we have. How our queues in backlog change. This kind of stuff. While obviously that would provide us some signal, that wouldn’t really be a proxy measure if we want to consider people first, not the process first.
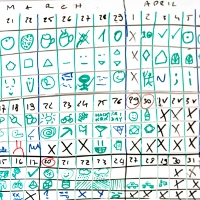
What strikes me is that we at Lunar Logic already use a nice signaling mechanism that would give us an early warning. The mechanism is a happiness chart. Despite the fact that a happiness chart is a super simple, super low-tech tool it works on a few levels.
On one level we have individuals. When I see a deviation from the norm in the chart of one person it likely means that something’s going wrong. It may be related to the work, it may be related to a personal life. Whatever the case is it does affect the work.
If the case is individual it will unlikely be related to the whole project.
Another context is the one of the whole company. If things were going generally wrong I’d expect to see a strong signal across the whole board. “Generally wrong” may mean either mediocre business results, or a cultural problem, or a strong source of frustration, or a bunch of different things.
In such situation the signal would be broader than just a single project or product team.
There’s another scenario, which would be a bunch of people recording worse than typical mood and the correlation would be around a common project. Process-related parameters of that project may look OK: a backlog queue wouldn’t grow, throughput would go up, etc. Is there anything wrong then?
In this case happiness chart would serve as blood pressure – it would be a countermeasure pointing that something is going not exactly OK and if we keep doing that we may end up crashing.
The rule for our happiness chart is that the color translates to the mood. Green means happy, blue means so-so, and red means not happy. Once the chart for a project team gets more bluish or even reddish that’s a very strong indicator that we are not absorbing turbulence in that team gracefully.
The interesting part is that a happiness chart would provide such an information no matter whether a root cause is overloading a team with tasks, interpersonal conflicts that affect collaboration or anything else. The alarm would go off in either case. That’s actually perfect as we want to react to dangerous turbulence early in any situation.
From that perspective the outcome of happiness chart isn’t a leading indicator per se – when the change is triggered it means that there’s already something happening. It isn’t a lagging one either. We can correlate it with other parameters or even check with people to figure out what is happening. We would know that we’re not coping with turbulence well enough much earlier than when we are on the verge of crashing.
The reason why I think this strategy is so valuable is because it allows to merge the data from two different universes. On one hand we have all the process metrics that tell us how we are doing from efficiency perspective. On the other we get a social metric that tell a lot whether the current state is sustainable.
It is exactly like a combination of a blood pressure and a heart rate. The former translate to efficient work of our steering center – the brain. The latter tells a little bit how sustainable current conditions are.
 Subscribe RSS feed
 Follow on Twitter
 Subscribe by email


2 comments… add one
This is a great idea for measuring not only the overload, but the general morale of the team from many other aspects. The key is to determine the root cause of any blue or red-ish indication in the chart.
In a recent project I was involved our Chief Project Manager had introduced project culture chart that was showing project team members mood and concerns. Updated on weekly basis it was a strong factor behind really awesome team work and team spirit we were capable to achieve. Definitely, I will reuse this tool in my future projects as well as your happiness chart since in my opinion both are valuable tools in building successful teams. Thanks for sharing. Cheers mate!