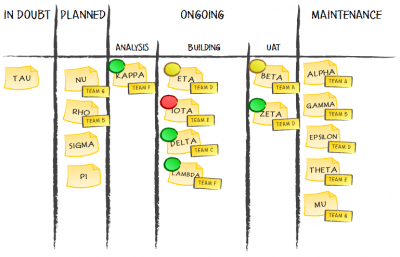
When I was starting my journey with Kanban on project portfolio level I based on a classic board design I knew from my work with Kanban within project teams. I basically tried to map value stream to the board but on a different level.
The effect was sort of predictable.

It was also naive.
The basic strength of such design is it’s very intuitive. Well, at least for these parts of the world that read from left to right. The same way we read the board: whatever is closer to the right edge of the board is closer to completion. The value stream we map may be a bit simplified (as me make it linear) but then it isn’t that much of a problem – after all index cards are flowing through the board pretty smoothly.
Unless you put on single index cards “tasks” that last a year or more, which is exactly what I have done.
When you’re looking at very long lasting projects you look for different information than in case of several hour long tasks. It isn’t that important how an index card is flowing through the board. After all you expect it to sit in one place for months. If you find out that the status of the index card has changed a few days late it likely isn’t a problem at all.
It is way more important, and interesting at the same time, to see teams’ capabilities in terms of undertaking new projects, i.e. how much more we can commit to our clients. Note: we aren’t talking about a single team of 7 (plus or minus 2). What we have here is 100+ people working on a couple dozen different projects concurrently. At this level capabilities are pretty damn difficult to estimate, especially given ever-changing business surroundings.
This is a huge weakness of the common board design: it doesn’t really help you with estimating free capabilities. It would help if we were able to set reasonable WIP limits on such board. Unfortunately, it is (close to) impossible.
A number of projects isn’t a good candidate to measure WIP, as projects differ in size hugely. If you use time-boxing you could try using a number of time-boxes as a measure. However in this case you don’t want to have a random team working on thirteenth iteration of a project that was build so far by the other team. With WIP limits measured by the number of iterations you would likely end up this way. Another idea was using money-related measures. This brings a question whether you sell all your work for the same prices. I guess that is true in very few cases and definitely mine is not one of them.
The longer I thought about it the more often I was coming back to people. I mean a team could start another project if they had some free people who could deal with it in planned/expected time frame. I even thought for a moment of setting base WIP limit around 130 (roughly a number of people working on projects represented on the board) and having each index card to weigh as much as there were people involved in a project at the time. The problem was the hassle needed to manage such board would be horrifying.
On the other hand measuring WIP in number of teams was way too coarse-grained as we had anything from multiple projects covered by a single team to multiple teams working on a single project.
All in all I ended up with a belief that, in terms of project portfolio Kanban, standard board design isn’t a good choice. I was ready to redesign the board completely.
If I piqued your interest read the whole project portfolio Kanban story.

 Subscribe RSS feed
I don’t think Kanban board is a good answer to your question. You have 100 people participating in various projects. So you need to know they specialization (like Java dev, Designer, Tester) and when these people can be relocated to another project or form another team. This information should flow from project managers (or anybody who knows it :).
Then you can draw projects timelines (similar to Gantt chart, but without dependencies) and even individual people timelines/allocations. It will not be enough though. Then you can combine all these data and have information like (next month we will have 12 people available, 2 java developers, 3 testers, 3 .net developers. etc). In 4 months we will have 30 people available. Etc. Can this be visualized? Yes, but with timelines, not usual Kanban Board.
@Michael – Is there something like The Only Correct Kanban Board Design? I believe we both agree that there’s no such thing. Kanban board, the way most of use it, is just one design which fortunately seems to work for many teams. However, we are never told that it is the one and the only approach.
Actually, as long as the board reflects (or at least tries to do it) Kanban principles and practices I will call it Kanban board. Btw: see the post on alternative board designs that shows a concrete example of such attitude.
In this case, well, drilling down to individual level wasn’t the goal. After all we don’t have just a bunch of generic developers, quality engineers or designers. We have teams and we want to preserve them. What more, we have something like business specialization, e.g. the team has deep knowledge on this or that subject matter, which is more important that technical specialization. In our case that is. I don’t want to generalize here.
However, because of project granularity I need more than just a team as a team can work on multiple project concurrently.
I like your way of thinking about time lines. Actually I chose the same path. What is interesting in terms of dealing with project portfolio is (available) WIP over time and not just here and now.
I disagree however on one thing: incorporating timeline to the board doesn’t mean it’s not a Kanban board anymore. Actually it may reflect Kanban principles even better than what you see in this post.
@Pawel
With such clarification indeed individual tracking does not make sense. It seems you can draw timeline for projects and group them by team. I sketched a concept that can be useful imho http://pm.stackexchange.com/a/5555/3340
Kanban Board visualizes flow. This new report will not visualize flow it seems. Well, this is not so important, how to name a thing, however, we should avoid generalization. In this case we can say that Gantt Chart is a slightly modified Kanban Board…
@Michael – You’ve almost drawn the board I currently use, not seeing it! It’s reassuring as it means that choices I made are sort of reasonable.
You point the flow. My question is: what would exactly be “flow” in terms of project?
My answer (basing on organization of projects in my org): flow is simple: planned project, ongoing project, project in maintenance. As we’re mostly thorough the transition to cross-functional teams and the old-school project stages (analysis, development, testing) are more and more vague and are overlapping I see little value in pursue to explicitly show them.
With such a simple flow you may ask yourself a question whether you really need to invest all the horizontal axis to represent it.
Of course the more complex flow the more you will be willing to show the standard Kanban way. But then, there are many factors that can affect the design of your portfolio Kanban board, size, length and variability of projects being an example from the top of my head.
And regarding using Gantt chart as a Kanban board, well, it’s not that far to use Gantt chart this way. I believe the main cause why it won’t be widely used that way is that people usually use Gantt charts in push way – they plan everything up front, thus ignoring pull principle standing behind Kanban.